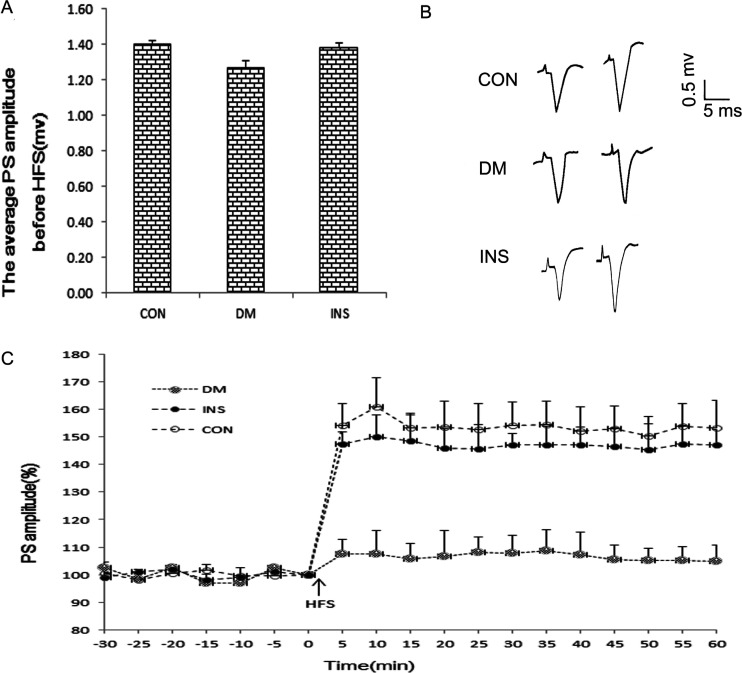
Figure 2.
Effects of insulin treatment on the LTP in diabetic rats. A, The average PS amplitude evoked by single pulse before HFS (n = 6). B, The representative waveforms of PS amplitude before and after HFS in CA1 region of hippocampus. C, The time trends of the PS potentiation rate before and after HFS (n = 6). Baseline responses were recoding following the delivery of test stimulus every 60 seconds, checking the stability for 30 minutes. The LTP was induced by 1 seconds 100 Hz stimulation. The PS was measured for 60 minutes after application of tetanic stimulation. HFS indicates high-frequency stimulation; LTP, long-term potentiation; PS, population spike.

