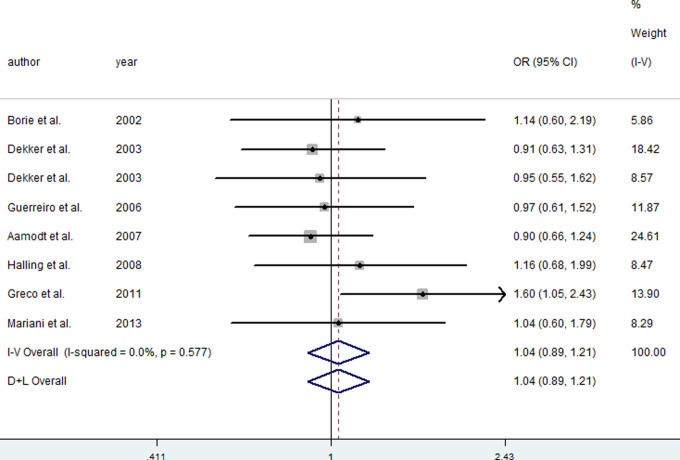
Figure 3.
Meta-analysis for the risk of Parkinson’s disease (PD) depending on the H63D polymorphism in the hemochromatosis (HFE) gene. Forest plots for relationship between the H63D polymorphism in the HFE gene and risk of PD in codominant model. White diamond denotes the pooled odds ratio (OR). Black squares indicate the OR in each study, with square sizes inversely proportional to the standard error of the OR. Horizontal lines represent 95% confidence intervals (CIs).
Note: Figure is available in full colour in the online version at aja.sagepub.com

