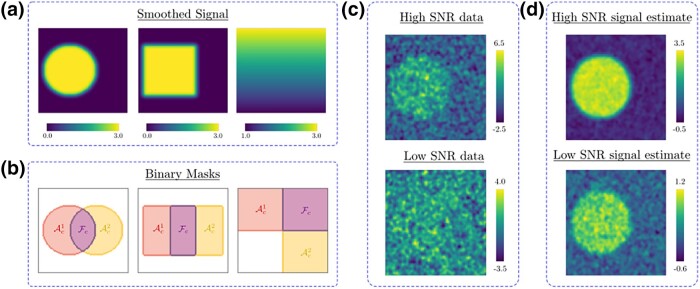
Figure 4.
(a) The circular, square, and ramp high-SNR signals used for in Simulations 1, 2, and 3, respectively. (b) Binary images for , and , for Simulations 1, 2, and 3. (c) Instances of the high- and low-SNR data generated for study condition 1 in Simulation 1. (d) The estimated mean signal for study condition 1, , in Simulation 1, generated using high-SNR, and low-SNR, simulated data instances.

