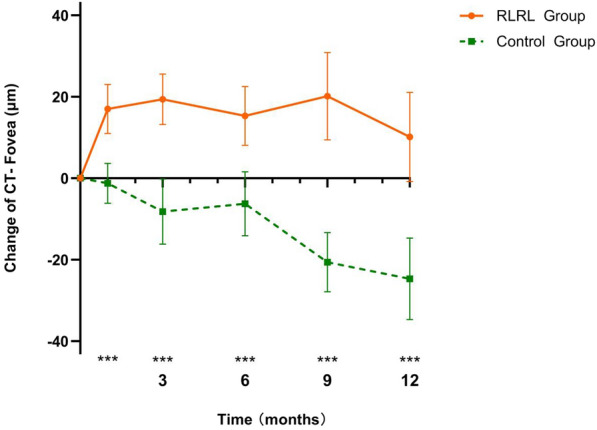
Fig. 2.

Adjusted mean changes in foveal CT at different time points in the control and RLRL groups. Asterisks indicate significant differences between groups at ***P < 0.05. CT Choroidal thickness, RLRL repeated low-level red-light

Adjusted mean changes in foveal CT at different time points in the control and RLRL groups. Asterisks indicate significant differences between groups at ***P < 0.05. CT Choroidal thickness, RLRL repeated low-level red-light