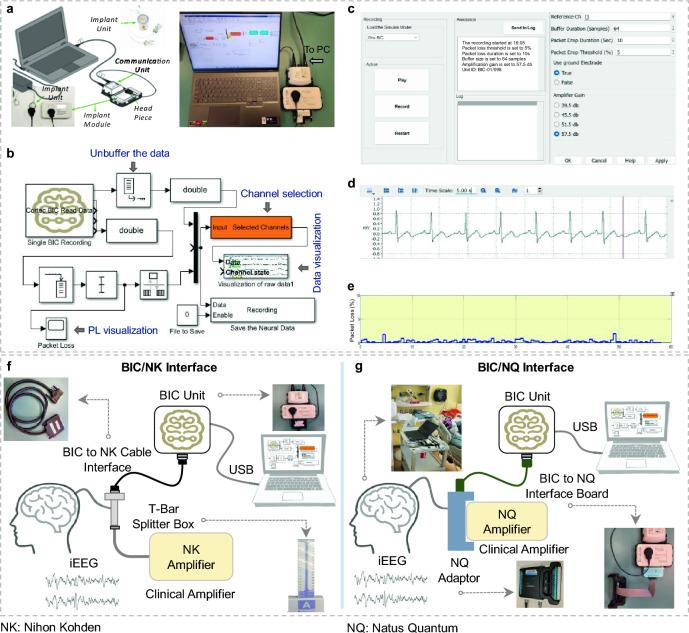
Figure 1.
(a) The BIC unit modules (Implant module, head piece, and communication unit and its connection to the computing station). On the bottom left part of the figure, the implant module next to implant itself is depicted. (b) The SIMULINK model and data acquisition pipeline to record and visualize the neural data in real-time. (c) The GUI controls the recording properties such as PL threshold, buffer size, etc. (d) Real-time data visualization using g.HIsys toolbox in the SIMULINK model. A 5-s ECG signal was used for visualization purposes. (e) The panel shows the online level of PL for a 60-s recording segment. (f) Recording setup for the BIC system in each clinical site. The panel shows the setup at St. Luke's Hospital for the BIC and NK recording. The iEEG signal was divided into two streams using the splitter box. One stream goes to the clinical amplifier, and the other stream goes to the BIC unit using a custom-designed cable interface. (g) Shows the setup at the TCH for the BIC and NQ recording, where the signal was divided into two streams using the NQ adaptor and directed to the NQ amplifier and the BIC unit using a custom adaptor board.

