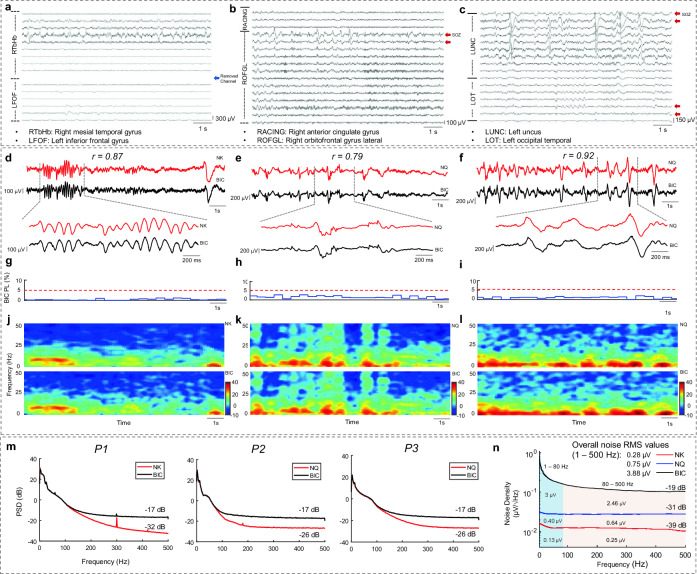
Figure 2.
A 16-channel visualization of raw iEEG data recorded by the BIC unit for representative subjects (a) P1, (b) P2, and (c) P3. The removed noisy channel is marked with a blue arrow, and SOZ channels are marked using red arrows. (d) Raw data visualization for a 12-s segment of P1 (BIC and NK systems), (e) P2 (BIC and NQ systems), and (f) P3 (BIC and NQ systems), along with a 2-s zoomed signal for each group. The correlation coefficient of the visualized segments was 0.87, 0.79, and 0.92 for P1, P2, and P3, respectively. (g) BIC unit PL for the corresponding 12-s segment for P1, (h) P2, and (i) P3. The red dashed line indicates a 5% PL level. (j) Time–Frequency map for the selected 12-s window for P1, (k) P2, and (l) P3. (m) Power spectral density of the recordings. BIC system PSD reached − 17 dB, while the NK system reached − 32 dB at 500 Hz for P1. For P2 recording (BIC vs. NQ), the PSD for the BIC reached − 17 dB and − 26 dB for the NQ system at 500 Hz. We observed similar performance as P2 (− 17 dB for BIC and − 26 dB for NQ at 500 Hz) for the P3. (n) The noise floor of each system was estimated with the shorted input test. The overall noise RMS values, along with the low and high band RMS values, are reported for each band (e.g., the BIC system's noise floor below 80 Hz is 3.00 µV).

