
Fig. 3. Local structure analysis of Mg-adp with PDFs.
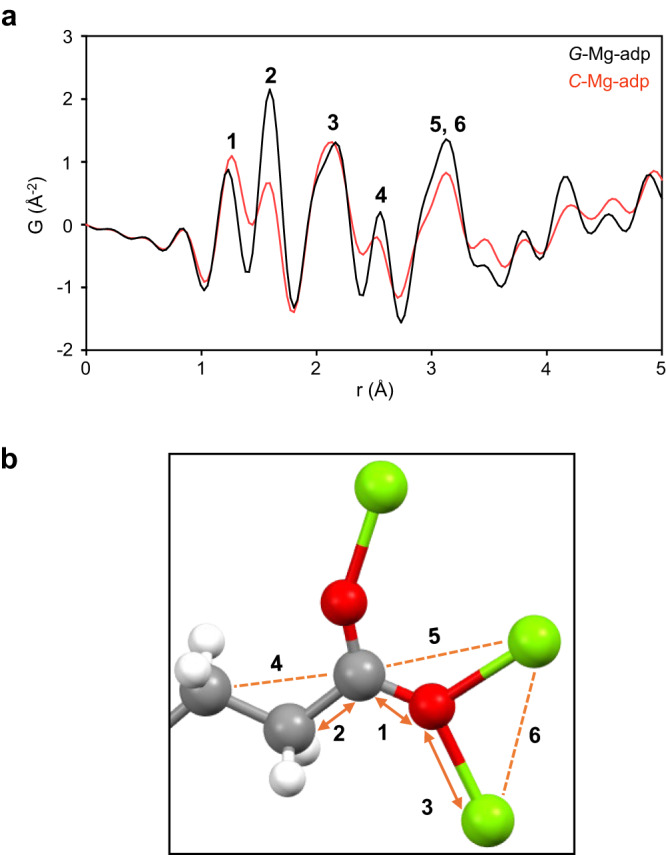
a The pair distribution function (PDF), G(r), as a function of distance between atom pairs, denoted as r, for samples of C-Mg-adp (red) and G-Mg-adp (black). b Local coordination environments of Mg-adp. To represent various bonding modes of adipates with similar correlation distances, the half fragment of one adipate with μ3 -η1: η2 mode is shown. 1–6 in the figure represent the bonds and correlations between two atoms, respectively. Color scheme: C, grey; O, red; H, white; and Mg, light green.