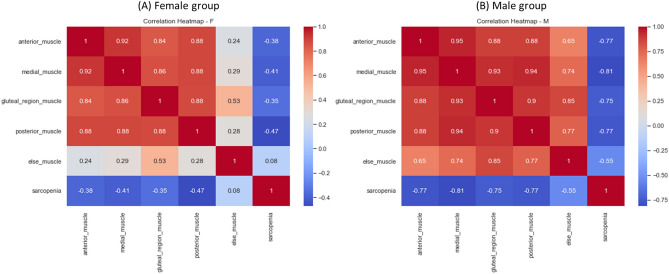
Figure 8.
Heatmap between Sarcopenia and thigh muscle groups. Presents a heatmap illustrating the relationship between Sarcopenia and grouped thigh muscles grouped by gender. Panel (A) represents the female group, while panel (B) represents the male group. In the male group, significant negative correlations were observed between Sarcopenia and the anterior thigh muscle group (r = − 0.77), medial thigh muscle group (r = − 0.81), gluteal region muscle group (r = − 0.75) and posterior thigh muscle group (r = − 0.77).

