

Abstract
Coastal risks in the Mediterranean are a result of the complex interplay between hydrometeorological and marine hazards. The region encompasses areas with varying degrees of vulnerability to these hazards, as well as spatial variations in exposure values, making it essential to adopt a comprehensive and nuanced approach to risk assessment and management. It is worth noting that hydrometeorological hazards, such as flash floods, can often have a greater impact than strictly coastal hazards, highlighting the need to consider the full range of potential risks. Therefore, coastal managers must adopt a multi-hazard approach to make sound risk management decisions. This study addresses this need using an index-based framework that assesses the integrated risk in time and space (hereafter referred to as cumulative compound risk) in coastal zones by aggregating the main hydrometeorological and marine hazards, the vulnerability of the territory to both types of hazards, and values at exposure. The framework is designed for use at large spatial scales (applied to a 1100 km coastline in this study), with the basic spatial unit being relevant for management (here set as the municipality in this study). Its application enables the assessment of spatial variations in integrated risk as well as individual hydrometeorological and marine contributions. The combined use of the indices and cluster analysis helps identify similarities and differences in the risk profile of spatial units, and thus, define homogeneous areas from a risk management perspective. In this study, the framework was applied to the Spanish Mediterranean coastline, an area representative of the climatic, geomorphological, and socioeconomic conditions of the Mediterranean coast.
Subject terms: Natural hazards, Ocean sciences
Introduction
The Mediterranean coast, particularly the Western basin, is a heavily developed region that has experienced a significant concentration of tourism-driven population and economies. As a result, the coastal zone has become home to a dense network of infrastructure, assets, and values that are at high risk of exposure1. Because of its location and climatology, its coastal zone is susceptible to frequent natural hazards from both land and sea domains surrounding the coastline. Thus, the area experiences frequent heavy rainfall, thunderstorms, windstorms, and severe weather events2 that lead to intense natural hazards such as flash floods acting inland3. On the other hand, the interaction between coastal dynamics and human activities, both inland and along the coast, has resulted in significant shoreline erosion4–6. This, together with the impact of storms, has caused significant damage along the entire coast7,8. The convergence of terrestrial and marine hazards in an area with large exposure values, makes the coast a high-risk hotspot 9–12. Additionally, it’s important to note that these multiple drivers and/or hazards can occur simultaneously, resulting in a combination known as compound weather and climate events13.
Zscheischler et al.14 proposed a classification of compound events that offers a useful framework for analysing the mechanisms underlying their impact, and for developing risk adaptation strategies. In this study, we focus on what they called multivariate, spatially, and temporally compound events. A multivariate event occurs when hazards from multiple climate drivers co-occur in the same area, such as the case of compound coastal flooding caused by the co-occurrence of marine (coastal storm) and terrestrial (rainfall or river flow) drivers acting in the same site. Spatially compound events refer to co-occurring hazards from different climate drivers within a time window acting on different areas, leading to impacts that accumulate at spatially distant locations. Finally, temporally compound events occur due to a succession of hazards affecting a geographical region, which can lead to or amplify the impact compared to a single hazard. All these types of compound events are relevant from the risk management standpoint, as they can overwhelm the capacity of emergency response services. This can stretch the resources of emergency services beyond their limits, making it difficult to respond effectively to all the affected areas. Notable examples of this have been observed during the November 196615 and 201816 storms in Italy and the January 2020 Gloria17,18 storm in Spain. The occurrence of such events may be aggravated by climate change, as the rates of change observed in the Mediterranean basin exceed global trends for most variables19. Thus, climate change is expected to increase the intensity of coastal hazards in the area owing to sea-level rise (SLR)-induced erosion6, inundation20, and an increase in storm-induced flooding21 and heavy precipitation events22 among other effects. If we include the projected increase in coastal exposure23 as an influencing factor, the overall risk in the Mediterranean coastal zone is expected to increase in future decades.
To tackle the challenge of analysing compound events, some guidelines have been proposed24, one of which involves the use of event-based storylines. Event-based storylines are a way of analysing and communicating the impacts of extreme weather and climate events, with a focus on plausibility rather than probability25. They provide information on the underlying causes of the event, and are particularly useful in disaster risk management as they allow stakeholders to create hypothetical scenarios and conduct stress-test to improve emergency preparedness. In our case study, we have adopted this approach and customized it to fit our needs. Our assumption is that the overall risk in the area is a result of the combined impact of terrestrial and marine-induced hazards. This worst-case scenario takes into account the possibility that areas with high levels of high hydrometeorological and marine risks will also experience a high compound risk, which we refer to as cumulative compound risk in the coastal zone. To provide context for this approach, it is important to note that the study area, which encompasses the Spanish Mediterranean coast, is prone to relatively frequent multivariate and spatially compound heavy rainfall and coastal storm events26.
As a result of this, it is essential to adopt a comprehensive and effective disaster risk management strategy that can effectively account for the complex interplay between various hazards. One approach to achieving this is to identify and characterize coastal hotspots that are at high risk for cumulative compound events. This enables stakeholders to focus their efforts on the areas that require the most attention and to develop targeted mitigation and preparedness measures to minimize the impact of potential disasters. In this context, index-based risk and vulnerability assessments have become widely used tools that adopt different methodologies and approaches27,28. Many of the current index-based coastal vulnerability and risk assessments in the Mediterranean region focus exclusively on marine-induced hazards, with little consideration given to hydrometeorological hazards29–31. In cases where hydrometeorological hazards are included, they are often integrated within the same indicator, resulting in an overall value that fails to capture the unique characteristics of each hazard32. This approach can limit the accuracy and precision of the risk assessment, making it difficult to develop effective disaster risk management strategies. A more nuanced approach, such as the event-based storyline approach we are adopting, can provide a more comprehensive understanding of the complex interplay between different hazards, enabling stakeholders to make better-informed decisions and take more targeted action to mitigate risks.
Within this context, this study aims to present an index-based framework to assess the cumulative compound risk in coastal zones by aggregating the main hydrometeorological and marine hazards, vulnerability of the territory to both types of hazards, and exposure of the socioeconomic system. The framework can assess the individual contributions to risk of both domains (hydrometeorological and marine), as well as the relative contribution of each risk component (hazard, vulnerability, and exposure). It has been developed considering the specificities and needs of the Mediterranean coast, although it can be adapted to other regions by considering additional hazards and including other variables relevant to the local conditions of risk components. The framework is applied to the Spanish Mediterranean coast (northwest (NW) Mediterranean), which is subjected to the impact of flash floods, coastal storms, and compound events, and has spatial heterogeneity in coastal geomorphology and exposure representative of a large part of the Mediterranean coastline. Table 1 shows the main weather and climatic drivers and hazards considered in this study, while the variables used to indicate them are shown in Table 2 and described in the “Methods” section.
Table 1.
Marine and hydrometeorological (terrestrial) drivers and hazards that act in each domain and control the cumulative compound risk in the coastal zone relevant to the study area.
| Domain | Driver | Hazard |
|---|---|---|
| Marine | Coastal storms | Erosion-flooding |
| Littoral dynamics | Mid-term erosion | |
| Sea level rise | Long-term erosion-inundation | |
| Terrestrial/hydrometeorological | Rainfall | Flash flood—river flood—bad weather |
| Thunderstorms | Flash floods | |
| Wind | Windstorms |
Table 2.
Data used to characterize marine and hydrometeorological hazards, vulnerability and coastal exposure, and for index validation.
| Variable | Source | Data period |
|---|---|---|
| Hazard | ||
| Marine | ||
| Significant wave height | SIMAR wave hindcast data base (Puertos del Estado) | 1958–2018 |
| Shoreline evolution rate | Aerial photographs (Institut Cartogràfic i Geològic de Catalunya (ICGC); Institut Cartogràfic Valencià (ICV)) | 1995–2018 |
| Low elevation zone slope | 2 m × 2 m Digital Elevation Models (ICGC; ICV) | 2014, 2010 |
| Shoreface slope | Global database40 plus local modifications using available local bathymetries | |
| Sea level rise | REDMAR Tidal gauge network (Puertos del Estado), IPCC AR6 regional projections41 | 1992–present |
| Hydrometeorological | ||
| Thunderstorms | Radar network of the Meteorological Service of Catalonia (SMC) and lightning network of the Spanish State Meteorological Agency (AEMET) | 2000–2018 |
| Maximum wind gust | Daily wind data from automatic weather stations (AEMET) | 1981–2015 |
| Rainfall | Daily precipitation from automatic weather stations (AEMET) | 1981–2015 |
| Vulnerability | ||
| Marine | ||
| Geomorphology | Aerial photographs (ICGC; ICV) | 2018 |
| Beach width | Aerial photographs (ICGC; ICV) | 2018 |
| Accommodation space | Aerial photographs (ICGC; ICV) | 2018 |
| Hydrometeorological | ||
| Soil permeability | Spanish Land Use Information System—SIOSE (National Centre for Geographic Information (CNIG)) | 2014 |
| Terrain slope | 200 m × 200 m Digital Terrain Model (CNIG) | 2015 |
| Stream order | Hydrographical Classification of Rivers (Spanish Centre for Hydrographic Studies (CEDEX) | 2016 |
| Exposure | ||
| Land use | Spanish Land Use Information System—SIOSE (CNIG) | 2014 |
| Transport network | Aerial photographs (ICGC; ICV) | 2018 |
| Gross Household Disposable Income | Statitiscal Institut of Catalonia (IDESCAT); Generalitat Valenciana | 2018 |
| Economic activity | Tourism indicators. IDESCAT; Generalitat Valenciana | 2018 |
| Population | IDESCAT; Generalitat Valenciana | 2018 |
| Validation | ||
| Cumulative damage | Compensatory payments by the Consorcio de Compensación de Seguros (CCS) | 1994–2021 |
| Damaging floods frequency | INUNGAMA database42 | 1981–2020 |
| Intensity of actual coastal damages | State of the Coastal Zone in Catalonia43 | 2000–2010 |
| Intensity of Gloria-storm induced coastal damages | Compilation from different sources | 2020 |
It’s worth noting that while storm surges are typically included in the analysis of compound coastal flooding33, we chose not to include them in our study because they are of very low amplitude in the study area34 and show little spatial variation along the coast. In other words, incorporating storm surges into our analysis would not have improved our characterization of coastal risk. Instead, we focused on wave-induced runup during storms, which is of much greater magnitude than storm surges in our study area, and is considered the main contributor to storm-induced coastal flooding34. Our approach is consistent with recent studies in the western Mediterranean that have used wave-induced runup and rainfall to characterize typical compound events in this region26. However, it’s important to note that storm surge could be included as an additional variable contributing to storm-induced marine hazards in areas where its magnitude is significant and/or where there is spatial variability. By taking a flexible and adaptable approach, disaster risk management strategies can be tailored to the specific hazards and drivers of risk in each region, resulting in more effective and targeted decisions to manage the impact of disasters.
Methodological framework
In the context of this study, risks result from the dynamic interaction between weather-related hazards (of marine and hydrometeorological origin) modulated by the vulnerability of the physical system (both coastal and inland) and the exposure of the affected human system in the coastal zone. This is simply formulated as the product of the three components, R = H · V · E.
The methodological framework adopted in this study is shown in Fig. 1, where the risk is first calculated separately for the marine and hydrometeorological components (MRI and HRI, respectively) and then integrated into a cumulative compound risk index (CCRI). The hazard and vulnerability sub-indices are formulated individually for each component, while the exposure index (IEX) is common to both, as it serves to characterise the values at exposure where both hazards act, the coastal fringe. The methodology adopted to assess the cumulative compound risk and all contributing components is described in detail in the “Methods” section.
Figure 1.

General framework to assess the cumulative compound risk index (CCRI). MHI marine hazard index, MVI marine vulnerability index, HHI hydrometeorological hazard index, HVI hydrometeorological vulnerability index, IEX exposure index, MRI marine risk index, HRI hydrometeorological risk index.
The indices used in this study were formulated following the generic form I = (I1 I2 … In/n)½, where n is the number of components contributing to the index. The indices were calculated for coastal segments at the smallest possible scale to obtain the best spatial characterization of the analysed component. In the case of the marine domain, it was determined by the spatial heterogeneity of the geomorphology along the coast (2181 coastal segments along the entire coastline were defined), and subsequently integrated up to a spatial unit that characterizes the basic management scale, which was set as the municipality for this study (129 units). In the case of the hydrometeorological domain, all variables were considered at the municipality scale. All indices were classified into five class intervals, using a scale of 1 to 5, which, in qualitative terms, were classified from very low (VL) to very high (VH) for values 1 to 5, respectively.
The coastal risk calculated using a given index is the result of applying a given equation and an associated scale. However, this does not necessarily imply that the values obtained reflect the real risk of the area; it reflects the relative magnitude of the variables used to characterise it along the coast. To address this uncertainty, we validated the proposed index for the study area. Because cumulative compound risk integrates the consequences of all hazards acting at different time scales, selecting a single variable that adequately reflects it on the ground is challenging. To address this concern, we performed a double validation using different types of data to characterise the damage. Details on the validation are provided in the “Methods” section.
Finally, coastal municipalities were grouped according to similar attributes of marine and hydrometeorological risks that can be used to define coherent management strategies. To this end, coastal municipalities were classified into five clusters using K-means with three seeding variables: marine and hydrometeorological hazards and vulnerabilities, and exposure along the coast.
Area of study and data
Area of study
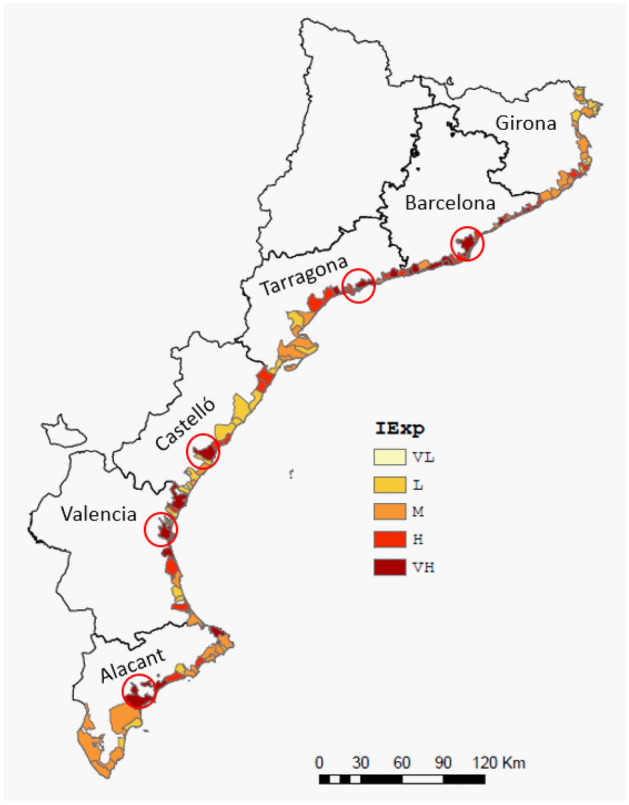
The study area extends along approximately 1100 km of the Spanish Mediterranean coast, and includes 129 municipalities in six provinces of two autonomous regions, Catalonia and Valencia (Fig. 2). It concentrates approximately 43% (3.23 M inhabitants) of the population of Catalonia and approximately 52% (2.6 M inhabitants) of the population of Valencia. Existing socio-economic activities are characteristic of Mediterranean coastal areas and are based on tourism, commerce, and agriculture35, with sun-and-beach tourism being the dominant activity36 that has led to the concentration of population and economic activities along the coastal fringe and surroundings over the last decades37.
Figure 2.

Map of the study area. Circles indicate the location of the capitals of each province and they correspond to the largest urban agglomerations, the cities of Barcelona, Tarragona, Castelló, Valencia and Alacant (by decreasing order of population). This map was created with Esri ArcGIS Pro 3 software (https://www.esri.com).
From a geomorphological perspective, the Spanish Mediterranean coastline presents a great diversity of coastal habitats, such as cliffs, rocky coasts, sandy beaches, coastal plains, estuaries, river deltas, and stretches of artificial coasts maintained by beach nourishment and protected by coastal structures38. The area is subject to natural hazards, such as shoreline erosion, coastal storm impacts, and flash floods, which have produced significant impacts and damage along the coastal zone3,5,8–11,17,18,39.
Data
The data used in this study can be grouped into those used to characterise hazards, vulnerability, and exposure and are listed in Table 2. All data were collected at the smallest available spatial scale according to the needs of each indicator (see the “Methods” section).
Results
The results of the application of the proposed methodology consist of an assessment of the cumulative compound risk along the Spanish Mediterranean coast, the marginal marine and hydrometeorological risks, and the contribution of each risk component, that is hazard, vulnerability, and exposure.
The marine domain
Figure 3a shows the spatial distribution of the marine hazard index integrated at the municipal level along the study area, and the statistics of municipalities per hazard class are shown in Table S1 (Supplementary Information). In general, coastal municipalities along the study area are subjected to a relatively low number of hazardous conditions, with only approximately 8% of the municipalities being classified as having a high or very high hazard level. However, this result should be carefully considered as these values integrate all segments within a given municipality and, in many cases, a large percentage of the coastline consists of rigid features (rocks, cliffs, and structures) which have a very low associated hazard value. When integrated with sedimentary segments within the municipality, their relative weights may dominate the final hazard value. To assess the potential importance of this factor, the percentage of rigid shoreline for each municipality along the study area was considered (Fig. 3c), which shows that areas with larger rigid coastlines are usually those subjected to low hazardous conditions.
Figure 3.

Marine hazard (3a, left), and vulnerability (3b, middle) indices; and percentage of sedimentary coastline with respect to total shoreline within each municipality (3c, right). (VL very low, L low, M medium, H high, VH very high). Circles indicate the location of the capitals of each province, if situated on the coast. These maps were created with Esri ArcGIS Pro 3 software (https://www.esri.com).
The percentage of shoreline length of the study area that belongs to each class with respect to the total coastline for all hazard indicators is shown in Fig. S2 (Supplementary Information). The results show that storms are the most important contributors to the most hazardous conditions, whereas shoreline evolution (with the exception of sea-level rise (SLR)) is the lowest owing to the large percentage of non-erodible coastlines. It must be stressed that the values associated with the SLR are dependent on the selected scenario, and this study used actual SLR values. This method of assessing marine hazards provides integrated values at the municipality scale and allows for smaller scale values (segments along the coast) to be retained for more detailed analysis if necessary.
The spatial distribution of the coastal vulnerability integrated at the municipal level is shown in Fig. 3b, and the statistics of the municipalities per class are shown in Table S1 (Supplementary Information). As shown in Fig. 3b and Table S1, coastal municipalities with high and very high vulnerability predominate throughout the study area, with nearly 60% of the municipalities belonging to these classes. As expected, the municipalities with low vulnerability correspond to those wherein the percentage of rigid coastline predominates (Fig. 3c). The coastal geomorphology and the lack of accommodation space are the main factors responsible for stretches with the highest vulnerability in the study area. The percentage of the shoreline length of the study area that belongs to each class for all vulnerability indicators is shown in Fig. S3 (Supplementary Information). The difference in the frequency of high vulnerability and hazard values along the coast would indicate that high-risk conditions in the area are driven more by the high sensitivity of the coast to the hazards under consideration than by the magnitude of the hazards.
The hydrometeorological domain
Coastal municipalities along the study area are subjected to high hydrometeorological hazardous conditions, with approximately 60% of the municipalities being classified as having high or very high hazard (Fig. 4, Table S2 in Supplementary Information). Among the variables considered to determine the hazard, wind is the lowest contributor to the overall hydrometeorological hazard in the area, with approximately 75% of the municipalities being ranked as having low or very low intensity (Fig. S4 in Supplementary Information).
Figure 4.

Hydrometeorological hazard (left) and vulnerability (right) indices along the study area. (VL very low, L low, M medium, H high, VH very high). Circles indicate the location of the capitals of each province, if situated on the coast. These maps were created with Esri ArcGIS Pro 3 software (https://www.esri.com).
The study area can be also classified as highly vulnerable to hydrometeorological hazards, with 80% of coastal municipalities being classified as having very high vulnerability (Fig. 4, Table S2 in Supplementary Information). This is consistent with the large occurrence of damaging flood events in the area over the last decades10,44. Among the variables considered to determine the vulnerability, the stream order is the largest contributor to the overall vulnerability (Fig. S5 in the Supplementary Information), presenting a relatively homogeneous distribution owing to the typical structure of river courses in the study area, mostly characterised by small catchment basins.
Exposure
The exposure values obtained for the study area are representative of a highly developed coastal zone, such as the Mediterranean, where the existence of a relatively large human concentration and its associated activities implies that approximately 42% of the municipalities have high and very high exposure, which, with the inclusion of the medium class, increases to 73% of the municipalities (Fig. 5). Notably, because land use and transport networks are the only two indicators classified in absolute terms (the other three are classified according to the quintile method and consequently reflect relative local conditions), they are the main factors that define the final variability in exposure conditions. This is evident in the distribution of high and very high classes that correspond to large urbanised areas around main cities, such as Barcelona, Tarragona, and Valencia. The percentages of municipalities belonging to each exposure class for each exposure indicator are shown in Fig. S6 (Supplementary Information).
Figure 5.
Coastal exposure index along the study area. (VL very low, L low, M medium, H high, VH very high). Circles indicate the location of the capitals of each province, if situated on the coast. This map was created with Esri ArcGIS Pro 3 software (https://www.esri.com).
Cumulative compound coastal risk
The highest risk conditions in the area are associated with the hydrometeorological component (HRI), with 82% of the municipalities belonging to high or very high-risk classes, whereas for marine-induced risks (MRI), these classes amount to 49% (Fig. 6, Table S3 in Supplementary Information). This result clearly indicates that any risk management strategy applied in this coastal zone cannot only address marine hazards but, on the contrary, has to adequately include the management of hydrometeorological-induced risks. This dominance is consistent with the findings of previous studies in the study area that identified flash floods as more damaging than coastal storm-induced flooding45.
Figure 6.

Marine (left) and hydrometeorological (right) risk indices along the study area. (VL very low, L low, M medium, H high, VH very high). Circles indicate the location of the capitals of each province, if situated on the coast. These maps were created with Esri ArcGIS Pro 3 software (https://www.esri.com).
When both type of risks are combined to evaluate the cumulative compound risk, the area is characterised by the dominance of high-and very high-risk conditions, with 26% and 43% of the municipalities falling into these categories, respectively (Fig. 7). This reflects one of the main characteristics of the NW Mediterranean coastal zone, where a combination of natural and socioeconomic conditions determines high-risk conditions20.
Figure 7.

Cumulative compound coastal risk (left) and classes of municipalities clustered in terms of their marine and hydrometeorological hazard and vulnerability, and exposure at the coastal zone (right). (VL very low, L low, M medium, H high, VH very high). Circles indicate the location of the capitals of each province, if situated on the coast. These maps were created with Esri ArcGIS Pro 3 software (https://www.esri.com).
Once partial and compound risk indices were calculated for all coastal municipalities, cluster analysis was applied to identify the existence of a spatial pattern underlying the values obtained, beyond the identification of sites with a higher or lower risk. Thus, the 129 municipalities in the area were grouped into five clusters, the main representative characteristics of which are shown in Table 3 and Fig. S7 (Supplementary Information). The first aspect to highlight is that, despite using the same seeding information, the clusters present a much clearer spatial pattern (Fig. 7) than the CCRI, and in this sense, they can be considered as an additional element to identify risk conditions in the area and help define risk management strategies.
Table 3.
Main characteristics of risk clusters.
| Cluster | Municipalities % (N) |
CCRI | MRI | HRI | IEX | MHV | HHV |
|---|---|---|---|---|---|---|---|
| C1 | 21.7 (28) | 4.2 | 3.6 | 3.6 | 2.4 | 4.3 | 4.3 |
| C2 | 20.9 (27) | 4.6 | 3.5 | 5 | 4.6 | 2.0 | 4.7 |
| C3 | 16.2 (21) | 3.2 | 2.5 | 3.3 | 2.5 | 2.2 | 3.6 |
| C4 | 20.9 (27) | 5.0 | 4.8 | 4.9 | 4.2 | 3.8 | 4.4 |
| C5 | 20.1 (26) | 2.9 | 1.9 | 4.0 | 2.6 | 1.3 | 4.9 |
Values are given as the average of the corresponding values to all municipalities belonging to each cluster. (CCRI cumulative compound risk, MRI marine risk, HRI hydrometeorological risk, IEX exposure, MHV marine hazard·vulnerability, HHV hydrometeorological hazard·vulnerability, % percentage of municipalities within the study area, N number of municipalities).
Thus, there were two clusters (C4 and C2) that stood out significantly with the highest compound risk values (Fig. S7, Supplementary Information). The municipalities that comprise them either present a very high risk (C4) or are distributed between very high and high conditions (C2). Despite this similarity, they presented different risk profiles, with C4 having much higher individual risks than C2. This is owing to the lower marine risk of C2, where the main contributor is high exposure, whereas the joint contribution of hazard and vulnerability is low. Their spatial distribution is very well defined, and they are concentrated in the most developed areas, such as the entire province of Barcelona, the northern half of Tarragona, most of the Valencia coast, and the central part of Alacant (Fig. 7). All of these correspond to coastal areas with a high population and, consequently, are largely urbanised. This is clearly evidenced in the average values of the exposure index IEX, which presented the highest values for all clusters (Table 3). At the opposite extreme, cluster C5 comprised areas with the lowest compound risk, for which, although they present a high hydrometeorological risk, the final value is determined by low marine risk and exposure indices. They are mainly concentrated along almost the entire coast of the province of Girona, the area of the Cape north of Alacant, and two spots in Castelló and south of Tarragona (Fig. 7). All these sites are characterised by rocky coastlines. Finally, the two remaining clusters are distributed as spots along the entire study area, with C1 comprising municipalities with high risk but low exposure values and C3 with medium values for risks and exposure indices.
Spatially, Barcelona Province presents the highest compound risk as well as marine and hydrometeorological risk. It concentrates the highest exposure and approximately 93% of its coastline (22 of its 27 municipalities) belongs to the riskiest clusters (C2 and C4) (Table S4 in Supplementary Information). By contrast, Girona presented the lowest compound risk, with only 16% of its coastline (four of its 22 municipalities) belonging to the riskiest clusters (C2 and C4) (Table S4 in Supplementary Information). This occurs for a province with a high hydrometeorological risk, as the lowest assessed marine risk owing to its large percentage of rocky coastline offsets its contribution to compounding. The areas with the highest compound risk are located in municipalities with intensive tourism, which have high exposure values, and a large part of their coastline is made up of beaches. The main risk characteristics of all provinces in the study area are listed in Table S4 (Supplementary Information).
Validation
The methodology proposed in this study enables the mapping of cumulative compound risks along the Catalan coast. However, because this is the result of the calculation of an index (set of equations) and the application of an intensity scale, validating them is essential to increase managers’ confidence in the results obtained. As CCRI integrates the action of a variety of hazards and values of exposure, we performed two different validation exercises (see the “Methods” section). Figure 8 shows a comparison of the calculated risk index with data on compensation payments by the Consorcio de Compensación de Seguros (CCS) for the impact of floods, coastal storms (sea battering), and extraordinary atypical cyclones, both integrated at the province scale. As shown in Fig. 8, there is a relationship between payments and CCRI in a manner that increasing values of CCRI result in increasing values of payments. However, there are two provinces in which payments exceed the expected value according to their CCRI values. Notably, these payments only cover damages for properties that have been insured, and do not correspond to the actual damage but to the percentage covered by the CCS. In addition, they integrate all damage within the province, not only in coastal municipalities. Regardless, because of the concentration of assets and population in the coastal zone, we assume that they are proportional to the damage caused by the considered hazards.
Figure 8.
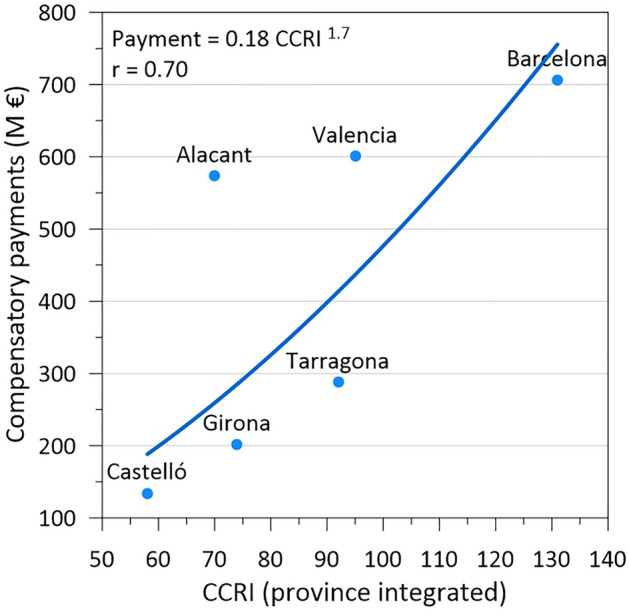
Compensatory payments by CCS for damages occasioned by extraordinary floods, sea storms, and atypical cyclones in the period 1994–2021 aggregated for the provinces of the study area versus the cumulative CCRI values (calculated as the sum of the indices for each coastal municipality for each province).
Table 4 shows the results of the second qualitative validation, where we compared CCRI with qualitative damage values integrating hydrometeorological (floods) and marine impacts, the damage index (see the “Methods” section). If we focus on the largest damage classes, that is, those with a value ≥ 3 (M, H, VH), 93% of them correspond to municipalities with a CCRI ≥ 3 (M, H, VH). By contrast, if we focus on the largest CCRI classes, that is, those with a value ≥ 3 (M, H, VH), 98% of them correspond to municipalities with a damage index ≥ 3 (M, H, VH). In summary, both validation exercises indicate that the higher the CCRI, the greater the damage associated with both types of hazards. Consequently, CCRI can be considered a good predictor of the expected cumulative compound coastal risk for Mediterranean conditions.
Table 4.
Number of municipalities along the Catalan coast classified in terms of the CCRI and damage index.
| CCRI | ||||||
|---|---|---|---|---|---|---|
| VL | L | M | H | VH | ||
| Damage index | VL | 0 | 0 | 0 | 0 | 0 |
| L | 0 | 1 | 1 | 0 | 0 | |
| M | 0 | 3 | 2 | 5 | 8 | |
| H | 0 | 2 | 7 | 9 | 23 | |
| VH | 0 | 0 | 0 | 1 | 8 | |
Discussion and conclusions
In this section, the proposed methodology and obtained results are discussed in terms of their applicability in coastal risk management. The proposed index, the CCRI, assesses the integrated contribution in space and time of marine and hydrometeorological hazards in a given spatial management-oriented unit, the municipality. It does not strictly reflect the risk associated with compound events, as described by Zscheischler et al.14, but characterizes the cumulative action of all contributing processes. Thus, the higher the CCRI, the greater are the risks associated with the different hazards at the site, and consequently, the greater is the importance of jointly considering them to adequately manage the overall coastal risk.
This method also retains the partial contributions of hydrometeorological and marine processes, which is relevant because their impacts and the way in which they are induced vary, and therefore, they should be managed differently. The approach adopted in this study defines risk in terms of three components, that is, hazard, vulnerability, and exposure, and this permits the identification of their relative contribution to the risk and, consequently, the investigation of risk reduction strategies addressing specific components.
One of the main challenges with classifying indicators is the choice of scale, which determines whether they reflect the relative or absolute conditions of the process represented. A typical example of relative scaling is the quintile method, which is one of the most widely used methods in index-based analysis46,47. However, although it serves to compare areas with each other, it does not necessarily characterise actual vulnerability/risk conditions and does not permit comparison with analyses at other sites48. We opted to use absolute-oriented scaling in a manner that allowed us to simultaneously compare across sites and characterise the actual considered magnitude. The basic sub-indices (hazards, vulnerability, and exposure) were classified on a scale of 1 to 5 by imposing a criterion whereby if the majority of their components (four of five, three of four, and two of three) belonged to a given class, the value corresponding to that combination determined the lower end of that class (Tables 5,6, 7). This resulted in a nonlinear scale where, if most of the variables contributed to inducing a very high hazard, vulnerability, or exposure, a single low value would not partially counteract them (Fig. 9). In the case of risk indices, a nonlinear scale was also used (Fig. 9) which resulted from applying the combination rules presented in Table 8.
Table 5.
Ranges determining the classes of variables and indices used to characterize marine hazards and vulnerability.
| VL | L | M | H | VH | |
|---|---|---|---|---|---|
| 1 | 2 | 3 | 4 | 5 | |
| Hazard | |||||
| Hs (m) | < 3.2 | [3.2, 4.0[ | [4.0, 4.8[ | [4.8, 5.9[ | ≥ 5.9 |
| SEL (m/a) | > 0.0 | [0.0, − 0.2[ | [− 0.2, − 1.0[ | [− 1.0, − 1.8[ | ≤ − 1.8 |
| SF slope | > 0.04 | [0.04, 0.02[ | [0.02, 0.01[ | [0.01, 0.009[ | ≤ 0.009 |
| mLECZ slope | > 0.0097 | [0.0097, 0.0074[ | [0.0074, 0.0039[ | [0.0039, 0.0024[ | ≤ 0.0024 |
| SLR (m) | < 0.24 | [0.24, 0.38[ | [0.38, 0.66[ | [0.66, 0.95[ | ≥ 0.95 |
| MHI | < 1.8 | 1.8–4.0 | 4.0–7.2 | 7.2–11.2 | > 11.2 |
| Vulnerability | |||||
| Geomorphology | Cliff/rocky | Artificial/revetment | Erodible cliff/bluff | Gravel | Sand |
| Beach width (m) | > 64 | [64, 48[ | [48, 32[ | [32, 16[ | ≤ 16 |
| Acomm space (% of beach length) | > 75 | [75, 50[ | [50, 25[ | ≤ 25 | No space |
| MVI | < 1.15 | 1.15–1.7 | 1.7–2.3 | 2.3–2.9 | > 2.9 |
Table 6.
Ranges determining the classes of variables and indices used to characterize hydrometeorological hazards and vulnerability.
| VL | L | M | H | VH | |
|---|---|---|---|---|---|
| 1 | 2 | 3 | 4 | 5 | |
| Hazard | |||||
| NTD (no. days/year) | ≤ 3 | [3, 5[ | [5.0, 10.0[ | [10.0, 15.0[ | ≥ 15.0 |
| MWG (km/h) | ≤ 50 | [50, 70[ | [70, 90[ | [90, 100[ | ≥ 100 |
| NRDS (no. days/year) | ≤ 10 | [10, 15[ | [15, 20[ | [20, 30[ | ≥ 30 |
| T20 (mm) | ≤ 40 | [40, 100[ | [100, 200[ | [200–300[ | ≥ 300 |
| HHI | < 1.4 | 1.4–2.6 | 2.6–4.0 | 4.0–5.6 | > 5.6 |
| Vulnerability | |||||
| Soil permeability (runoff coefficient) | < 0.36 | [0.36, 0.38[ | [0.38, 0.41[ | [0.41, 0.45[ | ≥ 0.45 |
| Slope (degrees) | ≤ 0.75 | [0.75, 1.5[ | [1.5, 3.0[ | [3.0, 6.0[ | ≥ 6.0 |
| Stream order | ≤ 1.5 | [1.5, 2.5[ | [2.5, 3.5[ | [3.5, 4.5[ | ≥ 4.5 |
| HVI | < 1.15 | 1.15–1.7 | 1.7–2.3 | 2.3–2.9 | > 2.9 |
Table 7.
Ranges determining the classes of variables and index used to characterize values at exposure.
| VL | L | M | H | VH | |
|---|---|---|---|---|---|
| 1 | 2 | 3 | 4 | 5 | |
| Exposure | |||||
| Land Use | Barren/Marshland, Grassland and Rockland | Forests and Parks | Beaches and Crops | Camping and Industry | Urban and Transport |
| Transport | No significant | Local road | National road | Motorway | Railway |
| GFDI (1000€/hab) | ≤ 11.9 | [11.9, 13.0[ | [13.0, 13.9[ | [13.9, 15.7[ | ≥ 15.7 |
| Economic Activity (places) | ≤ 583 | [583,1830[ | [1830, 5030[ | [5030–10696[ | ≥ 10,696 |
| Population (hab) | ≤ 4130 | [4130, 10585[ | [10585, 20053[ | [20053–33362[ | ≥ 33,362 |
| IEX | < 1.8 | 1.8–4.0 | 4.0–7.2 | 7.2–11.2 | > 11.2 |
Figure 9.

Scale for classifying and rescaling (i) basic indicators (hazard, vulnerability, exposure) as a function of the number of components composing them; and (ii) risk indices.
Table 8.
Rules for the reclassification of the product of two indices with values between 1 (VL) and 5 (VH). Resulting values shown in each cell inside the table (between 1 and 25) are reclassified on a scale of 1 to 5.
| Index 1 | |||||||
|---|---|---|---|---|---|---|---|
| VL | L | M | H | VH | |||
| 1 | 2 | 3 | 4 | 5 | |||
| Index 2 | VL | 1 | 1 | 2 | 3 | 4 | 5 |
| L | 2 | 2 | 4 | 6 | 8 | 10 | |
| M | 3 | 3 | 6 | 9 | 12 | 15 | |
| H | 4 | 4 | 8 | 12 | 16 | 20 | |
| VH | 5 | 5 | 10 | 15 | 20 | 25 | |
Another issue related to the scale is how the magnitude of the variables that compose the hazard, vulnerability, and exposure sub-indices is assessed. Variables contributing to the hazard, vulnerability, and exposure were classified using a scale referring to a well-defined target; although they reflect the characteristics of the study area, they can be easily adapted to local conditions elsewhere. For example, the medium-term erosion indicator was scaled with reference to the average beach width. Thus, the classes were defined according to the value required to erode a certain fraction of the average width. To apply it to another area or to fix a given management criterion, it is sufficient to change the reference value such that the scale is directly adjusted to local conditions while maintaining the same criterion. In other cases, variables were scaled using existing hazard scales for the study area (e.g., rainfall, winds, and storms), which can also be substituted by those existing in the area of application or if new risk warning criteria are set.
An important aspect usually not covered in the use of this type of indicator is its validation27,49. This is the only way to move from the results obtained by applying a set of equations and scale to the ground reality. In other words, we assess whether the indices measure what they are supposed to measure. In this study, we performed a double validation of the CCRI against two independent datasets representing the cumulative damage of the considered hazards in the coastal zone. Obtained results for aggregated values at the province scale indicate that CCRI is a good indicator of the cumulative compound risk, such that the larger the CCRI, the larger are the damage. The small-scale analysis shows a similar trend but with greater dispersion, which may be attributed to the qualitative nature of the information used.
Finally, the combined use of the indices and cluster analysis has proven to be a valuable approach for identifying spatial units that are homogeneous from the risk perspective. This allows for the identification of similarities and differences in the risk profiles of spatial units. From a management standpoint, it is clear that it is of high value to have both types of results to design more efficient risk-management strategies.
With respect to the study area, the cumulative compound coastal risk was dominated by the hydrometeorological component, which reached values significantly higher than those associated with the marine component. This agrees with the results of previous studies, where damage and impacts associated with flash floods have been identified as very important in terms of tangible damage and mortality9,44. It is necessary to consider that, while damages from marine-induced hazards are usually restricted to the outer coastal fringe and infrastructures therein11,50, hydrometeorological hazards impact a larger portion of the territory occupied by urbanized areas. In this sense, the increasing urbanisation in flood-prone areas permitted by local administrations during the last decades has largely shaped the current flood risk scenarios along the Spanish Mediterranean coast51.
With respect to the territory, the areas with the highest compound risk are concentrated in the most urbanised areas of the coastal zone, where the combination of the highest exposure, medium to high hazards, and vulnerability values dominate. This agrees with the findings of previous studies on river and flood damage along the Mediterranean Spanish coast that identified the dominant role of socio-economic factors in amplifying risks over climate-related factors52,53. Similarly, Jiménez et al.8 analysed the damage induced by marine storms along the Catalan coast during the second half of the twentieth century and found that, in the absence of an increase in storminess, the observed increasing trend could be explained by increasing values at exposure together with an increase in coastal vulnerability owing to decreasing beach widths.
The analysis suggests that urban development in the coastal zone is a significant contributor to the increase in risk. While climate change will exacerbate future risk levels, the increasing use of the term “climate emergency” to describe any extreme event affecting our coasts may obscure our role in creating this situation. It is crucial to recognize the human influence on coastal risk and take appropriate measures to mitigate the impacts of both climate change and human activities.
This socio-economic dependence of the risk links our results with those obtained by Brenner et al.54, who analysed socio-economic and environmental values in counties along the Catalan coast to define homogeneous management units to be used for integrated coastal zone management (ICZM). The homogeneous areas in their study have a similar spatial distribution to those defined here in terms of cumulative compound risk, and consequently, this will serve to introduce risk management-oriented criteria in the ICZM plans in addition to those based on the socioeconomic and environmental values obtained. In this regard, the Protocol for ICZM in the Mediterranean55 calls on the parties (countries) to develop natural risk prevention policies and, in particular, asks countries to undertake vulnerability and hazard assessments of coastal zones. The methods presented herein provide an easy-to-use and validated method to assess the importance of coastal risks associated with hydrometeorological and marine hazards which are especially relevant in coastal areas where the contribution of the hydrometeorological hazards to the risk in the terrestrial domain would be significant, such as the Mediterranean coast.
Finally, it has to be mentioned that the assessment of the compound coastal risk will be valid as long as the characteristics of the system (hazards, vulnerability and exposure) remain reasonably constant. Thus, the analysis should be updated when any change in the governing conditions is detected or predicted, or to integrate new observations of the variables considered.
Methods
Marine-induced risks
Hazards
The MHI index adopted to characterise the contribution of marine hazards to risks in the coastal zone follows the typical form of the CVI56 that has been widely used in the literature30,46,47,57–60. In this study, we considered the main marine hazards acting at three time-scales in the study area: episodic (storms), medium-term (decadal-scale rate of shoreline change), and long-term (sea-level rise). The index is given as MHI = (I1 I2 … I5/5)½, and the contributing components Ii are described below in terms of the variable used and the scale adopted.
Once the index was calculated, the resulting values were classified into five classes characterising the qualitative magnitude of the hazard and rescaled on a 1–5 scale according to the values shown in Table 5. The minimum values that delimit each class were fixed in absolute terms according to the criterion that at least four of the five indicators have a value corresponding to the class considered, and the remaining one has the lowest value (VL). For example, this implies that any combination with a value larger than 11.2 (resulting from calculating the index with four of the five indicators with a value of 5 (VH) and the remaining one with a value of 1 (VL)) is classified as VH.
Storms
To characterise the potential magnitude of the storms, the maximum value of the significant wave height, Hs, recorded in each segment along the coast over a period of time long enough to be representative of the local wave climate was selected. The data used were obtained from the SIMAR database, which extends from 1958 to the present and has a spatial resolution of approximately 0.08° (8.9 km) along the coast61,62. This maximum value can also be substituted by the Hs associated with a given return period; however, its use allows the characterisation of extreme waves without performing an extreme analysis that could be prevented in many sites because of the unavailability of the original wave time-series.
These Hs values were classified into five categories to characterise their contribution to the overall marine hazard intensity. For this purpose, a specific classification of storms on the Catalan coast63 was used, which allows the identification of potential damage in terms of erosion and flooding associated with the impact of coastal storms. The five resulting classes, VL to VH, correspond to the five categories of storms according to the used classification63, from weak to extreme. The intervals of the Hs values for each category are listed in Table 5. It must be stressed that this scale is tailored to the local conditions of the wave climate and can be adapted to other sites using values associated with other proposed storm scales for other areas64,65.
Mid-term shoreline evolution
To characterise the medium-term erosion hazard, we selected the shoreline displacement rate as a basic indicator. This was calculated for each beach along the study area using the DSAS tool66 with digitised shorelines from aerial photographs from the last 20 years. Shoreline evolution rates were calculated using linear regression or end-point-rate methods67 (depending on the number of available shorelines) in profiles approximately 100 m apart along the beach and then averaged to obtain a beach-integrated shoreline displacement rate.
The shoreline evolution rates thus obtained were then classified into five categories using an average “representative beach width” as a benchmark. This was calculated as the average value of all beach widths of less than 100 m in the study area, thus avoiding the weight of very wide beaches typical of deltaic areas, which, owing to their length, tends to underestimate vulnerability. The scale was then set by considering the resulting beach width under a given rate of evolution over a time period representative of the medium-term scale (taken as 25 years in this case). Class VH was established for erosion rates equal to or greater than those required to completely erode the “representative beach width” in 25 years. By contrast, class VL was associated with stable or accreting beaches. The ranges obtained for each class in the study area are presented in Table 5.
Inundation
We used the low-elevation coastal zone (LECZ) to characterise the inundation potential of the coastal zone along the study area. This zone has been widely used to identify coastal areas vulnerable to inundation at different scales, such as coastal flooding (storm-induced) and SLR68,69. Although this is originally defined as the land area contiguous with the coastline up to an elevation of 10 m with respect to the mean sea level70, in this study, we reduced its extension up to an elevation of 5 m altitude, as done in other coastal risk studies71, hereinafter denominated modified LECZ (mLECZ).
This factor was indicated by the slope of the mLECZ, which was calculated for each coastal segment along the study area and then classified into five categories. The hazard categories were selected based on the slope of the mLECZ required to induce inundation of a coastal strip of a given width under a reference SLR by the year 2100. The reference SLR was taken as the regional value for the AR6 SSP2-4.5 scenario (0.65 m). The cross-shore extents of the potentially inundated areas are referred to as the regional mean beach (considering all beaches), which is 67 m. Thus, class VH was established as the slope required to inundate a strip equal to the mean beach width for the zone plus 200 m under the reference SLR. This 200 m-value corresponds to the maximum extent of the protection buffer (a normative coastal setback) in the coastal zone, as defined in the Spanish coastal act72. The VL class corresponds to the slope required to inundate a strip, equal to the mean beach width. The intervals obtained for each class in the study area are presented in Table 5.
Sea-level rise
Sea-level rise is considered one of the most important forces inducing coastal hazards on a long-term scale. For the risks considered in this study, the relevant hazards are inundation and erosion, which depend on the magnitude of the forcing itself and the specific geomorphic characteristics of the coastal zone. The forcing is indicated here by the magnitude of the relative sea-level rise (RSLR), which is composed of a regional-scale projection of sea-level rise under a given climate scenario and a local component to account for possible changes in mean sea-level changes owing to subsidence. In the calculations presented in this study, we have employed tidal gauge data sourced from the REDMAR network for Spanish ports situated within the study area, spanning from 1992 to the present73. It is noteworthy that these data can be substituted with SLR projections to assess the potential impact of the marine hazard component under varying climate scenarios.
The magnitude of the RSLR was classified into five categories in relative terms based on the magnitude of the expected hazard with respect to the local characteristics of the coast. For this purpose, the RSLR-induced shoreline retreat for 2100 was assessed and compared with the average beach width in the study area. This was estimated using Bruun’s rule74 and the average shoreface slope of the study area (0.014). The resulting five classes correspond to values that induce a given shoreline retreat compared to the mean beach width (67 m). Thus, class VH corresponds to the RSLR value inducing a shoreline retreat equal to the mean beach width, whereas the VL class is limited by RSLR values inducing a shoreline retreat lower than 25% of the mean beach width. The intervals obtained for each class in the study area are presented in Table 5.
Shoreface slope
As mentioned above, in addition to the SLR, information on the geomorphic characteristics of the coast in also necessary to indicate the magnitude of the long-term hazard. Thus, to indicate the long-term erosion hazard potential, we selected the slope of the shoreface owing to the high sensitivity of SLR-induced retreat computations for that variable75–77.
To indicate its importance, we obtained the slope of the shoreface to approximately 10 m water depth, which is representative of the long-term depth of closure in the study area and has been previously used to calculate the SLR-induced erosion in the area76,78. This variable was classified into five categories based on the SLR-induced shoreline retreat for a shoreface with a given slope for the year 2100 under the regional value of the AR6 SSP2-4.5 scenario (0.65 m). The resulting five classes correspond to slope values that induce a given shoreline retreat compared to the mean beach width (considering all beaches) in the study area (67 m). Thus, class VH corresponds to a slope inducing a shoreline retreat equal to the mean beach width, whereas the VL class is limited by RSLR values, inducing a shoreline retreat lower than 25% of the mean beach width. The intervals obtained for each class in the study area are presented in Table 5.
Vulnerability
The vulnerability index (MVI) characterizes the potential of the coastal system to be harmed by the hazards presented in the previous sub-section. It measures the coast’s capacity to cope with induced impacts and, for this purpose, we considered three main components: coastal geomorphology resistance, resilience, and adaptive capacity. They were combined in the index form MVI = (I1 I2 I3/3)½, with the contributing components Ii described below. Once the index was calculated, the resulting values were classified into five classes characterising the qualitative magnitude of the hazard and rescaled on a 15 scale according to the values shown in Table 5. As in the case of hazards, the minimum values that delimit each class were set in absolute terms according to the criterion that at least two of the three indicators have a value corresponding to the class considered and the remaining one has the lowest value (VL).
Coastal geomorphology
Coastal geomorphology was used in this study as a qualitative indicator of the intrinsic vulnerability of a coastal stretch to any dynamic forcing, as it controls the magnitude of the potential response, that is, its relative erodibility. We followed the same approach as usually implemented in CVI79, where a coastal stretch is classified according to its geology/geomorphology into five different classes according to its susceptibility to erosion. The selected geomorphological types and their corresponding vulnerability classes are listed in Table 5. This is the most important variable and also control whether the other variables will be relevant or not.
Beach width/susceptibility
For segments composed of an erodible geomorphology class (from bluff to beaches), beach width is an important variable conditioning its risk to acting hazards. This variable is usually employed as a measure of the capacity of protection provided by the beach to the hinterland against the impact of marine forces80, such that the wider the beach is, the more protected the hinterland will be81–84. Thus, this variable can be used as a measure of the “resilient” capacity of the coast to cope with marine-induced hazards. It was classified into five categories as a function of the ratio of the local beach width using the expected regionally averaged shoreline retreat over 25 years as a benchmark. Thus, class VH corresponds to a beach width narrower than 25% of the expected regional-averaged shoreline retreat, including mid-term and long-term (SLR) processes (72 m). In contrast, the VL class corresponds to beaches wider than the mean erodible width in the study area. The intervals obtained for each class in the study area are presented in Table 5.
Accommodation space
The last variable that characterizes the vulnerability of the coast to considered hazards is the availability of accommodation space in the hinterland, that is, free space without rigid boundaries that would permit the horizontal migration and building of beaches as a response to coastal erosion or SLR, avoiding the appearance of coastal squeeze85. In contrast, the lack of accommodation space will lead to the disappearance of the beach under these forcings76,86. Thus, the existence of accommodation space can be used as a measure of the “natural capacity of adaptation” of the system. It should be noted that accommodation space is a relative concept. This is related to the expected magnitude of the shoreline retreat (and the expected migration) at a given time horizon under a given scenario76. In areas subjected to low erosion rates, the space required to allow landward migration should be small and vice versa. In this study and as a reference, we used a minimum extension of a 200 m-wide fringe behind the beach. Each segment was then analysed to measure the extension of the coast with such free space inland. The five resulting classes were based on the percentage of total beach length with sufficient accommodation space (Table 5).
Hydrometeorologically-induced risks
Hazards
The HHI proposed in this study characterizes the magnitude of the main hazards that play a relevant role in hydrometeorological risks at different scales along the Spanish Mediterranean coast. These are the extreme rainfall characterised by the 20-years return period of the daily rainfall (T20), number of rainy days during the summer (high tourist season), number of thunderstorm days, and maximum wind gust. These were integrated in the index in the form HHI = (I1 I2 I3 I4/4)½, and the contributing components Ii are described as follows. As in the previous cases, the HHI was classified into five classes and rescaled on a 1–5 scale according to the values shown in Table 6. Following the same approach, the minimum values that delimit each class were set in absolute terms according to the criterion that at least three of the four indicators have a value corresponding to the class considered and the remaining one has the lowest value (VL).
20-year return period of daily rainfall (T20)
This variable was used to characterise the heavy rainfall episodes that are responsible for flash floods. This corresponds to the daily rainfall associated with a return period of 20 years, which is the threshold that an annual extreme exceeds with a probability of 5%, and is usually employed to characterise heavy rainfalls events that are likely to occur 87,88. It was obtained by applying a Gumbel distribution for each AEMET station representative of each municipality based on a rainfall series of over 40 years. This was classified into five intensity classes based on the rainfall warning thresholds defined in Meteoalerta, the national Spanish weather warning system (AEMET), and the Meteorological Service of Catalonia (SMC). The resulting classifications are presented in Table 6.
Number of thunderstorm days
This indicator characterizes the threat to the population and infrastructure from severe weather (hail, strong winds, tornadoes, and convective storms), which can be parameterised in terms of lightning89 and is measured here by the number of days on which lightning is recorded in each municipality. This was calculated by counting lightning observations projected over a 1 km × 1 km matrix resolution during the period covered by the data (see “Data” section). Using this matrix, the strike density was calculated for each pixel and then averaged at the municipal level. The criteria used to classify this indicator according to the hazard level were based on quintiles and expert criteria (see Table 6).
Maximum wind gust
Extreme wind is an important meteorological hazard that can threaten life and infrastructures90. To characterise this factor, we calculated the 97.5th percentile of the daily time series of the maximum wind gusts of the available meteorological stations along the study area. Calculated values were later classified into five classes based on the wind warning thresholds used in the Spanish weather warning system (Meteoalerta) (AEMET) and SMC. The resulting classifications are presented in Table 6.
Number of rainy days per year during high season
This variable indicates a hydrometeorological threat affecting the recreational use of the coast (tourism), which is the main economic sector in most Mediterranean countries. Thus, in sun-and-beach destinations, the absence of rainy days is one of the elements determining the comfortability of users91. The high season, wherein the coastal zone (beaches) is not, was set from April to September, based on the usual influx of tourists to the study area. The variable was measured from the time-series of rainfall in meteorological stations in the study area, and values were classified according to the classes shown in Table 6.
Vulnerability
The hydrometeorological vulnerability index (HVI) characterizes the potential of coastal zones to be harmed by hydrometeorological hazards. Given the characteristics of the hazards considered in the study area, where flash floods are the dominant source of damage92, we considered three components, all of which characterise the area’s potential to favour flooding: soil permeability, slope, and stream order. They were combined in the index form MHI = (I1 I2 I3/3)½ and rescaled from to 1–5 classes following the same criterion used for the MVI.
Soil permeability
Soil permeability plays an important role in flooding, especially in flow velocity, and has an inverse relationship with it; a lower permeability indicates a lower infiltration capacity and a higher probability of waterlogging93. This was characterised by representative soil permeability at the municipal level. For this purpose, land-use classes were measured, and the 10-year return period of the runoff coefficient (Ce10) defined for different land use types was applied94 and averaged at the municipal scale. The over 100 original uses of the SIOSE database were reclassified into 15 groups according to the land use groups defined in Llasat et al.94. The resulting classes on the 5-interval scale are listed in Table 6.
Slope
The terrain slope is usually considered a key flood generation factor95; therefore, it is one of the main indicators of hydraulic hazards. This was characterised by a municipal average slope which was calculated from the available DTM of the study area. The 5-class scale to classify this indicator is shown in Table 6, where Meunier’s96 to define torrential rivers (slope ≥ 1.5%) and torrential water streams (slope ≥ 6%) was used.
Stream order
Finally, we also included the stream order, which indicates the level of branching of a river system, and is an indicator of the size of the drainage basin and discharge capacity; the larger the order number, the smaller is the catchment area draining to the stream97. In this study, the stream orders in the basins of the study area included in the CEDEX database were compared with those in areas where flash floods usually occur. The analysis revealed that streams usually experiencing flash floods tend to be of orders three to five, with 4 being the most common order. The proposed scale used to classify this indicator is presented in Table 6.
Exposure
To assess the consequences or damage induced by the considered hazards in the coastal zone, we characterised the existing values using an exposure index, IEX. Here we adopted the “total damage approach”, which means that no vulnerability curve is associated to any value, and therefore, it characterises the potential damage. It should be noted that this is the only component common to both domains (coastal and hydrometeorological). We considered a 500 m wide-fringe along the coast (measured landwards by the DPMT, a Spanish legal setback, usually located in the landward limit of beaches) where existing values at exposure may be damaged by the considered hazards. Then, adopting an approach inspired by that presented by Viavattene et al.83, five components were selected to characterise values at exposure, which are described below. They were combined as IEX = (I1 I2 … I5/5)½. It should be noted that the exposure is calculated at the municipal scale such that the same exposure value is applicable to all segments within a given municipality.
Once the index was calculated, the resulting values were classified into five classes characterising the qualitative magnitude of the values at exposure and rescaled on a 1–5 scale according to the values shown in Table 7. Following the same criteria adopted for the other indicators, the minimum values that delimit each class were set in absolute terms, according to the criterion that at least four of the five indicators have a value corresponding to the class considered, and the remaining one has the lowest value (VL).
Land use
This component valorises existing land use in the coastal zone which may be affected by the considered hazards. Original land use types were reclassified into five categories representing the main uses in the study area, and a value from 1 to 5 was assigned to each category to reflect their importance according to the study objectives. In this case, because the analysis was oriented towards safety-related issues, the highest values were allocated to human-related land use types (see Table 7). The component IEXLU was calculated as
where S is the percentage of surface occupied by a given land use type j within the 500 m-wide buffer of the segment, V is the assigned value (Table 7) for such use, and n is the number of uses in the buffer.
Transport
This component measures the relative exposure of the transport network, which is one of the most important infrastructures affected, not only because of its intrinsic value but also because of the impact its disruption can have on the economy of the area98. This component was estimated by identifying the type of existing transportation infrastructure within the 500 m buffer zone and associating a value with it according to its importance (Table 7), an approach already used in the study area11. These values can be modified to reflect the importance of the different components of the transport network where it is going to be applied.
GFDI
To measure the relative overall economic importance of the affected area, we use the gross household disposable income, GHDI, which is a macro-magnitude measure of the income available to the residents of a territory for consumption or savings, and it is increasingly used to characterise potential economic damage of natural hazards on affected population99. This component is obtained from official statistics and is provided at the municipal level; therefore, any coastal segment within a given municipality will have the same associated value. Their values are classified on a 1–5 scale according to the values shown in Table 7, which were obtained by means of the quintile method.
Coastal economic activity
To measure the potential impacts of hazards on the coastal-related economy, we selected the most representative sector in each municipality along the study area. As expected in the Mediterranean, the dominant activity is tourism100, which is represented by the number of accommodation places allocated to this activity in each coastal municipality. This variable, if combined with a typical economic indicator, such as average daily expenditure of tourists, provides an estimate of the potential economic income per municipality. In addition, a few other areas exist, such as the Ebro delta, where agriculture significantly dominates tourism, even in the coastal zone. In those locations, agriculture was considered the main economic activity and a value of 5 was directly assigned to their municipalities. This economic component was classified in the range of 1–5 using the quintile method (Table 7). As with the other components, this indicator can be modified to reflect local conditions at the application site.
Population
Finally, following most vulnerability assessment studies, this component accounted for the population of the study area101–103. This value was obtained from official statistics at the municipal level and classified on a 1–5 scale using the quintile method (Table 7).
Cumulative compound coastal risk
To obtain the risk index, the three individual sub-indices (hazard, vulnerability, and exposure) were combined as described here. First, the product of the hazard and vulnerability values, which varies between 1 and 25, was reclassified according to the rules presented in Table 8, resulting in a nonlinear reclassification wherein the limits for each class from VL to VH are given by (≤ 2, ≤ 5, ≤ 9, ≤ 15, > 15). The resulting values, once reclassified on a scale of 1–5, were then combined with the exposure index following the same rules to obtain the risk index. This was performed individually for the marine (MRI) and hydrometeorological (HRI) domains. Finally, the cumulative compound risk index (CCRI) was obtained in the same manner by combining the calculated marine and hydrometeorological risk indices.
In addition, the cumulative compound risk was mapped using the k-means clustering technique. In the context of coastal hazard and vulnerability analysis, different implementations of this technique exist, such as applying basic data to identify classes of different profiles104, reducing input data prior to index development105, or aggregating data prior to identifying existing classes106. For comparison with the CCRI-based classification, we classified coastal municipalities into five groups based on three seeding variables: marine and hydrometeorological hazards and vulnerabilities (defined as the product MHI·MVI and HHI·HVI, respectively), and exposure along the coast (IEX). In all cases, these variables are used once they were rescaled to 1–5 according to the procedures described above.
The main difference with respect to index-based classification is that, instead of ranking municipalities according to their risks, mapping is based on the similarities and differences in the components contributing to the compound risk. The objective was to group coastal municipalities according to similar attributes of marine and hydrometeorological risks that could be used to define coherent management strategies.
Index validation
The coastal vulnerability and/or risk calculated using a given index is the result of applying a given equation and an associated scale. To estimate its usefulness in representing actual risk conditions, we validated it for the study area. Because the calculated risk integrates the consequences of all hazards acting at different time scales, we performed a double validation using different types of data to characterise the damage.
First, we used the compensatory payments made by the Consorcio de Compensación de Seguros (CCS), which is an instrument in the service of the Spanish insurance sector that, among other functions, covers extraordinary risks, such as extraordinary floods, coastal storms (sea battering), and atypical cyclones107. The last one includes the action of violent tropical cyclones, intense cold lows, tornadoes and extreme winds108. Thus, we compared the compensatory payments by CCS associated with these natural hazards aggregated at the province scale, with the province-aggregated value of the cumulative compound risk index. This value was calculated by adding all CCRI values of the coastal municipalities composing each province. Insurance data have been successfully used as proxies for economic damage from floods109,110.
In addition, a second qualitative validation exercise was performed by comparing the province-aggregated CCRI with qualitative data on the damage associated with hydrometeorological and marine hazards in the coastal municipalities of the study area. The approach was to assess the cumulative observed/reported damages and rank them on a qualitative scale of 1 to 5, reflecting their importance. This was assessed separately for the marine and hydrometeorological domains and then added to provide a qualitative measure of their importance. Finally, the cumulative compound damage was obtained by adding hydrometeorological and marine-induced damage, the damage index, and reclassifying them on a 1–5 scale. In the case of hydrometeorological damage, we counted the number of damaging floods in each municipality incorporated in the Inungama database42. The range of the number of floods was then divided into five classes using equal-space intervals. For this purpose, the number of floods in the municipality of Barcelona was extracted to avoid overweighting, as the number of floods recorded was approximately 1.8 times that of the maximum value for the other municipalities. The lowest class was formed by the number of municipalities without floods. For marine hazards, we used two sources of qualitative data: intensity of damage reported by technical personnel of coastal municipalities of Catalonia to be representative of current conditions actual conditions43; and damage registered during the impact of the extreme coastal storm Gloria18,19. The occurrence of different types of damage in the coastal zone associated with these hazards was identified and scored according to the criteria listed in Table S5 (Supplementary Information). The overall marine damage was determined by averaging the resulting values for each type of data.
Supplementary Information
Acknowledgements
This study was conducted within the framework of the C3RiskMed (PID2020-113638RB-C21/22, AEI/10.13039/501100011033) and M-CostAdapt (CTM2017-83655-C2-1/2-R) research projects funded by the Spanish Ministry of Science and Innovation. The first author was funded by a PhD Grant from the Ministry of Science and Innovation (PRE2018-084174).
Author contributions
The idea behind this study was conceived and developed by J.A.J. and M.C.L. J.A.J. developed the methodology, prepared Fig. 1 and all figures in the Supplementary Information (SI), performed the integrated analysis with R.R., and wrote the original manuscript with contributions from R.R., I.C.L., and M.C.L. R.R. evaluated the marine and compound indices, applied cluster analysis, was responsible for data curation and mapping, and produced all figures with the exception of Fig. 1 and those in the SI. I.C.L., J.G., and M.C. evaluated the hydrometeorological index. M.C.L. was responsible for developing the hydrometeorological risk index. M.L. provided the data on flood damage used in the validation. T.R. provided data on lightning and important suggestions for hydrometeorological hazard estimations. HIV produced the basic coastal segments, computed the mid-term shoreline evolution indicator, and the components for the marine vulnerability indicator. All the authors contributed to the review and editing of the manuscript.
Data availability
All data used to inform this study are available from open-source databases identified in Table 2. All data generated from this study are available from the corresponding author on reasonable request.
Competing interests
The authors declare no competing interests.
Footnotes
Publisher's note
Springer Nature remains neutral with regard to jurisdictional claims in published maps and institutional affiliations.
Supplementary Information
The online version contains supplementary material available at 10.1038/s41598-024-53899-z.
References
- 1.UNEP/MAP-Plan Bleu . State of the Environment and Development in the Mediterranean. UNEP/MAP-Plan Bleu; 2009. p. 340. [Google Scholar]
- 2.Llasat MC. Storms and floods. In: Woodward J, editor. The Physical Geography of the Mediterranean Basin. Oxford University Press; 2009. pp. 504–531. [Google Scholar]
- 3.Llasat MC, et al. High-impact floods and flash floods in Mediterranean countries: The FLASH preliminary database. Adv. Geosci. 2010;23:47–55. doi: 10.5194/adgeo-23-47-2010. [DOI] [Google Scholar]
- 4.Pranzini E. Shore protection in Italy: From hard to soft engineering… and back. Ocean Coast. Manag. 2018;156:43–57. doi: 10.1016/j.ocecoaman.2017.04.018. [DOI] [Google Scholar]
- 5.Jiménez JA, Valdemoro HI. Shoreline evolution and its management implications in beaches along the Catalan coast. In: Morales JA, editor. The Spanish Coastal Systems Dynamic Processes, Sediments and Management. Springer; 2019. pp. 745–764. [Google Scholar]
- 6.Vousdoukas MI, et al. Sandy coastlines under threat of erosion. Nat. Clim. Change. 2020;10:260–263. doi: 10.1038/s41558-020-0697-0. [DOI] [Google Scholar]
- 7.Ciavola P, Harley MD, Den Heijer C. The RISC-KIT storm impact database: A new tool in support of DRR. Coast. Eng. 2018;134:24–32. doi: 10.1016/j.coastaleng.2017.08.016. [DOI] [Google Scholar]
- 8.Jiménez JA, Sancho-García A, Bosom E, Valdemoro HI, Guillén J. Storm-induced damages along the Catalan coast (NW Mediterranean) during the period 1958–2008. Geomorphology. 2012;143:24–33. doi: 10.1016/j.geomorph.2011.07.034. [DOI] [Google Scholar]
- 9.Gil-Guirado S, Pérez-Morales A, Lopez-Martinez F. SMC-Flood database: A high-resolution press database on flood cases for the Spanish Mediterranean coast (1960–2015) Nat. Hazards Earth Syst. Sci. 2019;19:1955–1971. doi: 10.5194/nhess-19-1955-2019. [DOI] [Google Scholar]
- 10.Paprotny D, Vousdoukas MI, Morales-Nápoles O, Jonkman SN, Feyen L. Pan-European hydrodynamic models and their ability to identify compound floods. Nat. Hazards. 2020;101:933–957. doi: 10.1007/s11069-020-03902-3. [DOI] [Google Scholar]
- 11.Jiménez JA, Sanuy M, Ballesteros C, Valdemoro HI. The Tordera Delta, a hotspot to storm impacts in the coast northwards of Barcelona (NW Mediterranean) Coast. Eng. 2018;134:148–158. doi: 10.1016/j.coastaleng.2017.08.012. [DOI] [Google Scholar]
- 12.Anfuso G, Pranzini E, Vitale G. An integrated approach to coastal erosion problems in northern Tuscany (Italy): Littoral morphological evolution and cell distribution. Geomorphology. 2011;129:204–214. doi: 10.1016/j.geomorph.2011.01.023. [DOI] [Google Scholar]
- 13.Zscheischler J, et al. Future climate risk from compound events. Nat. Clim. Change. 2018;8:469–477. doi: 10.1038/s41558-018-0156-3. [DOI] [Google Scholar]
- 14.Zscheischler J, et al. A typology of compound weather and climate events. Nat. Rev. Earth Environ. 2020;1:333–347. doi: 10.1038/s43017-020-0060-z. [DOI] [Google Scholar]
- 15.De Zolt S, Lionello P, Nuhu A, Tomasin A. The disastrous storm of 4 November 1966 on Italy. Nat. Hazards Earth Syst. Sci. 2006;6:861–879. doi: 10.5194/nhess-6-861-2006. [DOI] [Google Scholar]
- 16.Davolio S, Della Fera S, Laviola S, Miglietta MM, Levizzani V. Heavy precipitation over Italy from the Mediterranean storm “Vaia” in October 2018: Assessing the role of an atmospheric river. Month. Weather Rev. 2020;148:3571–3588. doi: 10.1175/MWR-D-20-0021.1. [DOI] [Google Scholar]
- 17.Amores A, Marcos M, Carrió DS, Gómez-Pujol L. Coastal impacts of Storm Gloria (January 2020) over the north-western Mediterranean. Nat. Hazards Earth Syst. Sci. 2020;20:1955–1968. doi: 10.5194/nhess-20-1955-2020. [DOI] [Google Scholar]
- 18.Canals M, Miranda J. Sobre el temporal Gloria (19–23.01.20), els seus efectes sobre el país i el que se’n deriva. Report de Resposta Ràpida (R3) Institut d’Estudis Catalans; 2020. p. 196. [Google Scholar]
- 19.Cramer W, et al. Climate change and interconnected risks to sustainable development in the Mediterranean. Nat. Clim. Change. 2018;8:972–980. doi: 10.1038/s41558-018-0299-2. [DOI] [Google Scholar]
- 20.Antonioli F, et al. Relative sea-level rise and potential submersion risk for 2100 on 16 coastal plains of the Mediterranean sea. Water. 2020;12:2173. doi: 10.3390/w12082173. [DOI] [Google Scholar]
- 21.Vousdoukas MI, et al. Global probabilistic projections of extreme sea levels show intensification of coastal flood hazard. Nat. Commun. 2018;9:1–12. doi: 10.1038/s41467-018-04692-w. [DOI] [PMC free article] [PubMed] [Google Scholar]
- 22.Tramblay Y, Somot S. Future evolution of extreme precipitation in the Mediterranean. Clim. Change. 2018;151:289–302. doi: 10.1007/s10584-018-2300-5. [DOI] [Google Scholar]
- 23.Wolff C, Nikoletopoulos T, Hinkel J, Vafeidis AT. Future urban development exacerbates coastal exposure in the Mediterranean. Sci. Rep. 2020;10:1–11. doi: 10.1038/s41598-020-70928-9. [DOI] [PMC free article] [PubMed] [Google Scholar]
- 24.Bevacqua E, et al. Guidelines for studying diverse types of compound weather and climate events. Earth’s Future. 2021;9:e2021EF002340. doi: 10.1029/2021EF002340. [DOI] [Google Scholar]
- 25.Sillmann J, Shepherd TG, van den Hurk B, Hazeleger W, Martius O, Slingo J, Zscheischler J. Event-based storylines to address climate risk. Earth’s Future. 2021;9:e2020EF001783. doi: 10.1029/2020EF001783. [DOI] [Google Scholar]
- 26.Sanuy M, Rigó T, Jiménez JA, Llasat MC. Classifying compound coastal storm and heavy rainfall events in the north-western Spanish Mediterranean. Hydrol. Earth Syst. Sci. 2021;25:3759–3781. doi: 10.5194/hess-25-3759-2021. [DOI] [Google Scholar]
- 27.Nguyen TT, Bonetti J, Rogers K, Woodroffe CD. Indicator-based assessment of climate-change impacts on coasts: A review of concepts, methodological approaches and vulnerability indices. Ocean Coast. Manag. 2016;123:18–43. doi: 10.1016/j.ocecoaman.2015.11.022. [DOI] [Google Scholar]
- 28.Shah MAR, et al. A review of hydrometeorological hazard, vulnerability, and risk assessment frameworks and indicators in the context of nature-based solutions. Int. J. Dis. Risk Red. 2020;50:101728. [Google Scholar]
- 29.Le Cozannet G, et al. An AHP-derived method for mapping the physical vulnerability of coastal areas at regional scales. Nat. Hazards Earth Syst. Sci. 2013;13:1209–1227. doi: 10.5194/nhess-13-1209-2013. [DOI] [Google Scholar]
- 30.Koroglu A, Ranasinghe R, Jiménez JA, Dastgheib A. Comparison of coastal vulnerability index applications for Barcelona Province. Ocean Coast. Manag. 2019;178:104799. doi: 10.1016/j.ocecoaman.2019.05.001. [DOI] [Google Scholar]
- 31.Furlan E, et al. Development of a multi-dimensional coastal vulnerability index: Assessing vulnerability to inundation scenarios in the Italian coast. Sci. Total Environ. 2021;772:144650. doi: 10.1016/j.scitotenv.2020.144650. [DOI] [PubMed] [Google Scholar]
- 32.Satta A, Snoussi M, Puddu M, Flayou L, Hout R. An index-based method to assess risks of climate-related hazards in coastal zones: The case of Tetouan. Estuar. Coast. Shelf Sci. 2016;175:93–105. doi: 10.1016/j.ecss.2016.03.021. [DOI] [Google Scholar]
- 33.Bevacqua E, et al. Higher probability of compound flooding from precipitation and storm surge in Europe under anthropogenic climate change. Sci. Adv. 2019;5:5531. doi: 10.1126/sciadv.aaw5531. [DOI] [PMC free article] [PubMed] [Google Scholar]
- 34.Mendoza E, Jiménez JA. Regional geomorphic vulnerability analysis of Catalan beaches to storms. Proc. ICE Maritime Eng. 2009;162(3):127–135. doi: 10.1680/maen.2009.162.3.127. [DOI] [Google Scholar]
- 35.Sardá R, Avila C, Mora J. A methodological approach to be used in integrated coastal zone management process: The case of the Catalan Coast (Catalonia, Spain) Estuar. Coast. Shelf Sci. 2005;62:427–439. doi: 10.1016/j.ecss.2004.09.028. [DOI] [Google Scholar]
- 36.Yepes V, Medina JR. Land use tourism models in Spanish coastal areas. A case study of the Valencia region. J. Coast. Res. 2005;49:83–88. [Google Scholar]
- 37.Serra P, Vera A, Tulla AF, Salvati L. Beyond urban–rural dichotomy: Exploring socioeconomic and land-use processes of change in Spain (1991–2011) Appl. Geogr. 2014;55:71–81. doi: 10.1016/j.apgeog.2014.09.005. [DOI] [Google Scholar]
- 38.Morales JA, Pérez-Alberti A. Introducing the Spanish coast. In: Morales JA, editor. The Spanish Coastal Systems. Springer; 2019. pp. 1–23. [Google Scholar]
- 39.Pardo-Pascual JE, Sanjaume E. Beaches in Valencian coast. In: Morales JA, editor. The Spanish Coastal Systems. Springer; 2019. pp. 209–236. [Google Scholar]
- 40.Athanasiou P, et al. Global distribution of nearshore slopes with implications for coastal retreat. Earth Syst. Sci. Data. 2019;11:1515–1529. doi: 10.5194/essd-11-1515-2019. [DOI] [Google Scholar]
- 41.Garner, G. G. et al. IPCC AR6 Sea-Level Rise Projections. Version 20210809. PO.DAAC, CA, USA. https://podaac.jpl.nasa.gov/announcements/2021-08-09-Sea-level-projections-from-the-IPCC-6th-Assessment-Report (Accessed 12 December 2021) (2021).
- 42.Barnolas M, Llasat MC. A flood geodatabase and its climatological applications: The case of Catalonia for the last century. Nat. Hazards Earth Syst. Sci. 2007;7:271–281. doi: 10.5194/nhess-7-271-2007. [DOI] [Google Scholar]
- 43.CIIRC . Estat de la zona costanera a Catalunya. Dept. Política Territorial i Obres Públiques; 2010. [Google Scholar]
- 44.Llasat MC, et al. Towards a database on societal impact of Mediterranean floods within the framework of the HYMEX project. Nat. Hazards Earth Syst. Sci. 2013;13:1337–1350. doi: 10.5194/nhess-13-1337-2013. [DOI] [Google Scholar]
- 45.Ballesteros C, Jiménez JA, Viavattene C. A multi-component flood risk assessment in the Maresme coast (NW Mediterranean) Nat. Hazards. 2018;90:265–292. doi: 10.1007/s11069-017-3042-9. [DOI] [Google Scholar]
- 46.Pendleton, E. A., Thieler, R. S. & Williams, J. Coastal Vulnerability Assessment of Fire Island National Seashore (FIIS) to Sea Level Rise. USGS Open File Rep, 03-439 (2004).
- 47.Abuodha PAO, Woodroffe CD. Assessing vulnerability to sea-level rise using a coastal sensitivity index: A case study from southeast Australia. J. Coast. Conserv. 2010;14:189–205. doi: 10.1007/s11852-010-0097-0. [DOI] [Google Scholar]
- 48.Tibbetts JR, van Proosdij D. Development of a relative coastal vulnerability index in a macro-tidal environment for climate change adaptation. J. Coast. Conserv. 2013;17:775–797. doi: 10.1007/s11852-013-0277-9. [DOI] [Google Scholar]
- 49.Bukvic A, Rohat G, Apotsos A, de Sherbinin A. A systematic review of coastal vulnerability mapping. Sustainability. 2020;12:2822. doi: 10.3390/su12072822. [DOI] [Google Scholar]
- 50.Sanuy M, Duo E, Jäger WS, Ciavola P, Jiménez JA. Linking source with consequences of coastal storm impacts for climate change and risk reduction scenarios for Mediterranean sandy beaches. Nat. Hazards Earth Syst. Sci. 2018;18:1825–1847. doi: 10.5194/nhess-18-1825-2018. [DOI] [Google Scholar]
- 51.López-Martínez F, Pérez-Morales A, Illán-Fernández EJ. Are local administrations really in charge of flood risk management governance? The Spanish Mediterranean coastline and its institutional vulnerability issues. J. Environ. Plan. Manag. 2020;63:257–274. doi: 10.1080/09640568.2019.1577551. [DOI] [Google Scholar]
- 52.Barredo JI, Saurí D, Llasat MC. Assessing trends in insured losses from floods in Spain 1971–2008. Nat. Hazards Earth Syst. Sci. 2012;12:1723–1729. doi: 10.5194/nhess-12-1723-2012. [DOI] [Google Scholar]
- 53.Pérez-Morales A, Gil-Guirado S, Olcina-Cantos J. Housing bubbles and the increase of flood exposure. Failures in flood risk management on the Spanish south-eastern coast (1975–2013) J. Flood Risk Manag. 2018;11:S302–S313. doi: 10.1111/jfr3.12207. [DOI] [Google Scholar]
- 54.Brenner J, Jimenez JA, Sardá R. Definition of homogeneous environmental management units for the Catalan coast. Environ. Manag. 2006;38:993–1005. doi: 10.1007/s00267-005-0210-6. [DOI] [PubMed] [Google Scholar]
- 55.UNEP. Protocol on Integrated Coastal Zone Management in the Mediterranean (Split, Priority Actions Programme, 2008)
- 56.Gornitz V. Global coastal hazards from future sea level rise. Palaeogeogr. Palaeoclimatol. Palaeoecol. 1991;89:379–398. doi: 10.1016/0031-0182(91)90173-O. [DOI] [Google Scholar]
- 57.Shaw J, Taylor RB, Forbes DL, Ruz MH, Solomon S. Sensitivity of the Coasts of Canada to Sea-Level Rise. Geological Survey of Canada; 1998. p. 505. [Google Scholar]
- 58.López RM, Ranasinghe R, Jiménez JA. A rapid, low-cost approach to coastal vulnerability assessment at a national level. J. Coast. Res. 2016;32:932–945. doi: 10.2112/JCOASTRES-D-14-00217.1. [DOI] [Google Scholar]
- 59.Mohd FA, et al. Comprehensive coastal vulnerability assessment and adaptation for Cherating-Pekan coast, Pahang, Malaysia. Ocean Coast. Manag. 2019;182:104948. doi: 10.1016/j.ocecoaman.2019.104948. [DOI] [Google Scholar]
- 60.Sekovski I, Del Río L, Armaroli C. Development of a coastal vulnerability index using analytical hierarchy process and application to Ravenna province (Italy) Ocean Coast. Manag. 2020;183:104982. doi: 10.1016/j.ocecoaman.2019.104982. [DOI] [Google Scholar]
- 61.Pilar P, Soares CG, Carretero J. 44-Year wave hindcast for the North East Atlantic European coast. Coast. Eng. 2008;55:861–871. doi: 10.1016/j.coastaleng.2008.02.027. [DOI] [Google Scholar]
- 62.Martínez-Asensio A, et al. Response of the North Atlantic wave climate to atmospheric modes of variability. Int. J. Climatol. 2016;36:1210–1225. doi: 10.1002/joc.4415. [DOI] [Google Scholar]
- 63.Mendoza ET, Jimenez JA, Mateo J, Salat J. A coastal storms intensity scale for the Catalan sea (NW Mediterranean) Nat. Hazards Earth Syst. Sci. 2011;11:2453–2462. doi: 10.5194/nhess-11-2453-2011. [DOI] [Google Scholar]
- 64.Dolan R, Davis RE. An intensity scale for Atlantic coast northeast storms. J. Coast. Res. 1992;8:840–853. [Google Scholar]
- 65.Molina R, Manno G, Lo Re C, Anfuso G, Ciraolo G. Storm energy flux characterization along the Mediterranean coast of Andalusia (Spain) Water. 2019;11:509. doi: 10.3390/w11030509. [DOI] [Google Scholar]
- 66.Himmelstoss, E. A., Henderson, R. E., Kratzmann, M. G. & Farris, A. Digital Shoreline Analysis System (DSAS) Version 5.1. Userguide. USGS Open-File Report 2021-1091 (2021).
- 67.Dolan R, Fenster MS, Holme SJ. Temporal analysis of shoreline recession and accretion. J. Coast. Res. 1991;7:723–744. [Google Scholar]
- 68.Neumann B, Vafeidis AT, Zimmermann J, Nicholls RJ. Future coastal population growth and exposure to sea-level rise and coastal flooding-a global assessment. PLoS ONE. 2015;10:e0118571. doi: 10.1371/journal.pone.0118571. [DOI] [PMC free article] [PubMed] [Google Scholar]
- 69.Kulp SA, Strauss BH. New elevation data triple estimates of global vulnerability to sea-level rise and coastal flooding. Nat. Commun. 2019;10:1–12. doi: 10.1038/s41467-019-12808-z. [DOI] [PMC free article] [PubMed] [Google Scholar]
- 70.McGranahan G, Balk D, Anderson B. The rising tide: Assessing the risks of climate change and human settlements in low elevation coastal zones. Environ. Urban. 2007;19:17–37. doi: 10.1177/0956247807076960. [DOI] [Google Scholar]
- 71.Rizzo A, et al. Potential sea level rise inundation in the Mediterranean: From susceptibility assessment to risk scenarios for policy action. Water. 2022;14:416. doi: 10.3390/w14030416. [DOI] [Google Scholar]
- 72.Sanò M, et al. The role of coastal setbacks in the context of coastal erosion and climate change. Ocean Coast. Manag. 2011;54:943–950. doi: 10.1016/j.ocecoaman.2011.06.008. [DOI] [Google Scholar]
- 73.Pérez Gómez B, et al. Coastal sea level monitoring in the Mediterranean and Black seas. Ocean Sci. 2022;18:997–1053. doi: 10.5194/os-18-997-2022. [DOI] [Google Scholar]
- 74.Bruun P. Sea level rise as a cause of shore erosion. J. Waterw. Harbour. Div. 1962;88:117–130. doi: 10.1061/JWHEAU.0000252. [DOI] [Google Scholar]
- 75.Hinkel J, et al. A global analysis of erosion of sandy beaches and sea-level rise: An application of DIVA. Glob. Planet. Change. 2013;111:150–158. doi: 10.1016/j.gloplacha.2013.09.002. [DOI] [Google Scholar]
- 76.Jiménez JA, Valdemoro HI, Bosom E, Sánchez-Arcilla A, Nicholls RJ. Impacts of sea-level rise-induced erosion on the Catalan coast. Reg. Environ. Change. 2017;17:593–603. doi: 10.1007/s10113-016-1052-x. [DOI] [Google Scholar]
- 77.Udo K, Takeda Y. Projections of future beach loss in Japan due to sea-level rise and uncertainties in projected beach loss. Coast. Eng. J. 2017;59:1740006. doi: 10.1142/S057856341740006X. [DOI] [Google Scholar]
- 78.López-Doriga U, Jiménez JA, Valdemoro HI, Nicholls RJ. Impact of sea-level rise on the tourist-carrying capacity of Catalan beaches. Ocean. Coast. Manag. 2019;170:40–50. doi: 10.1016/j.ocecoaman.2018.12.028. [DOI] [Google Scholar]
- 79.Thieler, E. R. & Hammar-Klose, E. S. National Assessment of Coastal Vulnerability to Future Sea-Level Rise: Preliminary Results for U.S. Atlantic Coast, USGS. Open File Report 99–593 (1999).
- 80.Liquete C, Zulian G, Delgado I, Stips A, Maes J. Assessment of coastal protection as an ecosystem service in Europe. Ecol. Indic. 2013;30:205–217. doi: 10.1016/j.ecolind.2013.02.013. [DOI] [Google Scholar]
- 81.Bush DM, Neal WJ, Young RS, Pilkey OH. Utilization of geoindicators for rapid assessment of coastal-hazard risk and mitigation. Ocean. Coast. Manag. 1999;42:647–670. doi: 10.1016/S0964-5691(99)00027-7. [DOI] [Google Scholar]
- 82.Bosom E, Jiménez JA. Probabilistic coastal vulnerability assessment to storms at regional scale-application to Catalan beaches (NW Mediterranean) Nat. Hazards Earth. Syst. Sci. 2011;11:475–484. doi: 10.5194/nhess-11-475-2011. [DOI] [Google Scholar]
- 83.Viavattene C, et al. Selecting coastal hotspots to storm impacts at the regional scale: A coastal risk assessment framework. Coast. Eng. 2018;134:33–47. doi: 10.1016/j.coastaleng.2017.09.002. [DOI] [Google Scholar]
- 84.Leaman CK, et al. A storm hazard matrix combining coastal flooding and beach erosion. Coast. Eng. 2021;170:104001. doi: 10.1016/j.coastaleng.2021.104001. [DOI] [Google Scholar]
- 85.Silva R, et al. A framework to manage coastal squeeze. Sustainability. 2020;12:10610. doi: 10.3390/su122410610. [DOI] [Google Scholar]
- 86.Diaz-Cuevas P, Prieto-Campos A, Ojeda-Zújar J. Developing a beach erosion sensitivity indicator using relational spatial databases and analytic hierarchy process. Ocean Coast. Manag. 2020;189:105146. doi: 10.1016/j.ocecoaman.2020.105146. [DOI] [Google Scholar]
- 87.Kharin VV, Zwiers FW, Zhang X, Hegerl GC. Changes in temperature and precipitation extremes in the IPCC ensemble of global coupled model simulations. J. Clim. 2007;20:1419–1444. doi: 10.1175/JCLI4066.1. [DOI] [Google Scholar]
- 88.IPCC . Managing the Risks of Extreme Events and Disasters to Advance Climate Change Adaption (SREX) Intergovernmental Panel on Climate Change, Cambridge University Press; 2012. [Google Scholar]
- 89.Pineda N, Rigo T, Bech J, Soler X. Lightning and precipitation relationship in summer thunderstorms: Case studies in the North Western Mediterranean region. Atmos. Res. 2007;85:159–170. doi: 10.1016/j.atmosres.2006.12.004. [DOI] [Google Scholar]
- 90.Pinto JG, Karremann MK, Born K, Della-Marta PM, Klawa M. Loss potentials associated with European windstorms under future climate conditions. Clim. Res. 2012;54:1–20. doi: 10.3354/cr01111. [DOI] [Google Scholar]
- 91.Demiroglu OC, Saygili-Araci FS, Pacal A, Hall CM, Kurnaz ML. Future holiday climate index (HCI) performance of urban and beach destinations in the Mediterranean. Atmosphere. 2020;11:911. doi: 10.3390/atmos11090911. [DOI] [Google Scholar]
- 92.Llasat MC, Marcos R, Turco M, Gilabert J, Llasat-Botija M. Trends in flash flood events versus convective precipitation in the mediterranean region: The case of Catalonia. J. Hydrol. 2016;541:24–37. doi: 10.1016/j.jhydrol.2016.05.040. [DOI] [Google Scholar]
- 93.Karmakar S, Simonovic SP, Peck A, Black J. An information system for risk-vulnerability assessment to flood. J. Geogr. Inf. Syst. 2010;2:129. [Google Scholar]
- 94.Llasat, M. C. et al. A multifactorial analysis of flood variability in the Metropolitan Area of Barcelona. In International Conference on Urban Risks, ICUR 2016 283-290 (2016).
- 95.Georgakakos KP. On the design of national, real-time warning systems with capability for site-specific, flash-flood forecasts. Bull. Am. Meteorol. Soc. 1986;67:1233–1239. doi: 10.1175/1520-0477(1986)067<1233:OTDONR>2.0.CO;2. [DOI] [Google Scholar]
- 96.Meunier M. Elements d’hydraulique torrentielle. Etudes du CEMAGREF; 1991. [Google Scholar]
- 97.Strahler AN. Quantitative analysis of watershed geomorphology. Eos. 1957;38:913–920. [Google Scholar]
- 98.Demirel H, Kompil M, Nemry FA. framework to analyze the vulnerability of European road networks due to sea-level rise (SLR) and sea storm surges. Transp. Res. A. 2015;81:62–76. [Google Scholar]
- 99.Paprotny D, et al. A probabilistic approach to estimating residential losses from different flood types. Nat. Hazards. 2021;105:2569–2601. doi: 10.1007/s11069-020-04413-x. [DOI] [Google Scholar]
- 100.Garola A, López-Dóriga U, Jiménez JA. The economic impact of sea level rise-induced decrease in the carrying capacity of Catalan beaches (NW Mediterranean, Spain) Ocean Coast. Manag. 2022;218:106034. doi: 10.1016/j.ocecoaman.2022.106034. [DOI] [Google Scholar]
- 101.Gornitz V. Vulnerability of the East Coast, USA to future sea level rise. J. Coast. Res. 1990;9:201–237. [Google Scholar]
- 102.Hughes P, Brundrit GB. An index to assess South Africa’s vulnerability to sea-level rise. S. Afr. J. Sci. 1992;88:308–311. [Google Scholar]
- 103.McLaughlin S, Cooper JAG. A multi-scale coastal vulnerability index: A tool for coastal managers? Environ. Hazards. 2010;9:233–248. doi: 10.3763/ehaz.2010.0052. [DOI] [Google Scholar]
- 104.Wood NJ, Jones J, Spielman S, Schmidtlein MC. Community clusters of tsunami vulnerability in the US Pacific Northwest. Proc. Natl. Acad. Sci. 2015;112:5354–5359. doi: 10.1073/pnas.1420309112. [DOI] [PMC free article] [PubMed] [Google Scholar]
- 105.Calil J, Reguero BG, Zamora AR, Losada IJ, Méndez FJ. Comparative coastal risk index (CCRI): A multidisciplinary risk index for Latin America and the Caribbean. PLoS ONE. 2017;12:e0187011. doi: 10.1371/journal.pone.0187011. [DOI] [PMC free article] [PubMed] [Google Scholar]
- 106.Fernandez P, Mourato S, Moreira M, Pereira L. A new approach for computing a flood vulnerability index using cluster analysis. Phys. Chem. Earth A/B/C. 2016;94:47–55. doi: 10.1016/j.pce.2016.04.003. [DOI] [Google Scholar]
- 107.CCS . Estadística Riesgos extraordinarios. Serie 1971–2021. Consorcio de Compensación de Seguros; 2021. [Google Scholar]
- 108.López Vilares P, Asensio Ruiz M. Consorseguros Digital. Consorcio de Compensación de Seguros; 2022. p. 11. [Google Scholar]
- 109.Spekkers MH, Kok M, Clemens FH, Ten Veldhuis JA. A statistical analysis of insurance damage claims related to rainfall extremes. Hydrol. Earth Syst. Sci. 2013;17:913–922. doi: 10.5194/hess-17-913-2013. [DOI] [Google Scholar]
- 110.Cortes M, Turco M, Llasat-Botija M, Llasat MC. The relationship between precipitation and insurance data for floods in a Mediterranean region (northeast Spain) Nat. Hazards Earth Syst. Sci. 2018;18:857–868. doi: 10.5194/nhess-18-857-2018. [DOI] [Google Scholar]
Associated Data
This section collects any data citations, data availability statements, or supplementary materials included in this article.
Supplementary Materials
Data Availability Statement
All data used to inform this study are available from open-source databases identified in Table 2. All data generated from this study are available from the corresponding author on reasonable request.