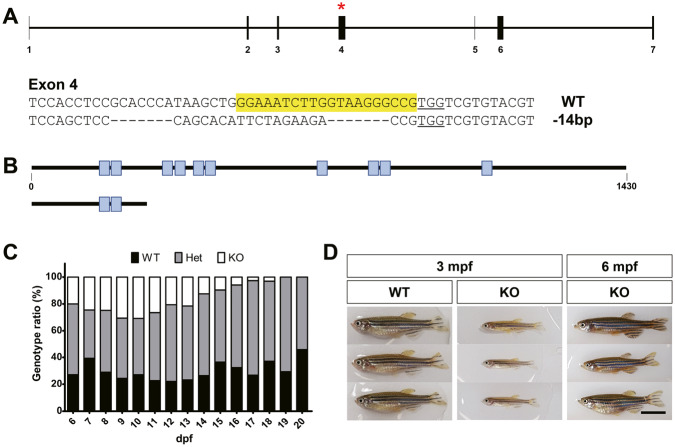
Fig. 1. Generation of znf536 KO zebrafish and growth phenotype analysis.
A Generation of the znf536 KO line. Red asterisk (upper panel) and yellow box (lower panel) indicate the sgRNA target region. B Schematic representation of predicted proteins in the WT and KO. Blue boxes indicate the zinc finger C2H2 domains. C Genotype ratio for larval stage zebrafish from heterozygous incrosses (6–20 dpf) (n = 1433). D Representative images of znf536 WT and KO zebrafish at 3 and 6 mpf adult stages. n = 14 for WT, n = 44 for Het, and n = 9 for KO (3 mpf); n = 9 for KO (6 mpf). Scale bar: 10 mm.

