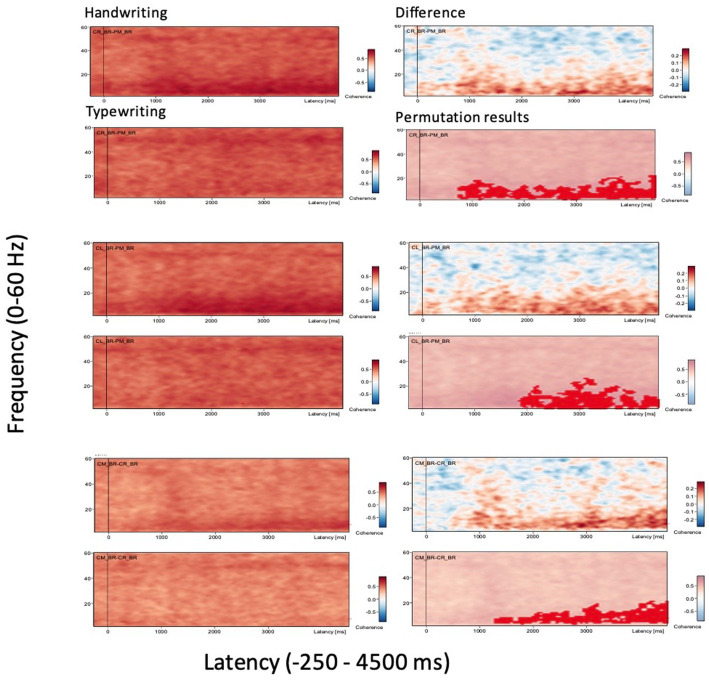
Figure 2.
Grand average coherence results. Displayed are only three selected connectivity areas of interest for the two experimental conditions handwriting and typewriting (left panels), together with the difference in coherence between writing and typing and their permutation results (right panels). Connectivity areas of large significant difference between handwriting and typewriting included brain regions CR-PM (central right-parietal midline, top two panels on the left) and CL-PM (central left-parietal midline, middle two panels on the left), as well as CM-CR (central midline-central right, bottom two panels on the left), in frequencies ranging from theta (2 Hz) and up to gamma (60 Hz). The x-axes display the time interval from baseline to 4,500 ms of recordings of the trial. The signal magnitude reflects the estimated neural connectivity strength between the various brain areas during the experimental conditions compared to baseline activity (−250 to 0 ms). Positive connectivity is shown as (shades of) red-colored contours in handwriting/typewriting plots (panels on the left) and difference plots between handwriting and typewriting/permutation results (panels on the right). Positive connectivity is significantly more prominent in lower frequencies (theta 3.5–7.5 Hz and alpha 8–12.5) for handwriting (0 ≤ p < 0.05, see also Figure 4).

