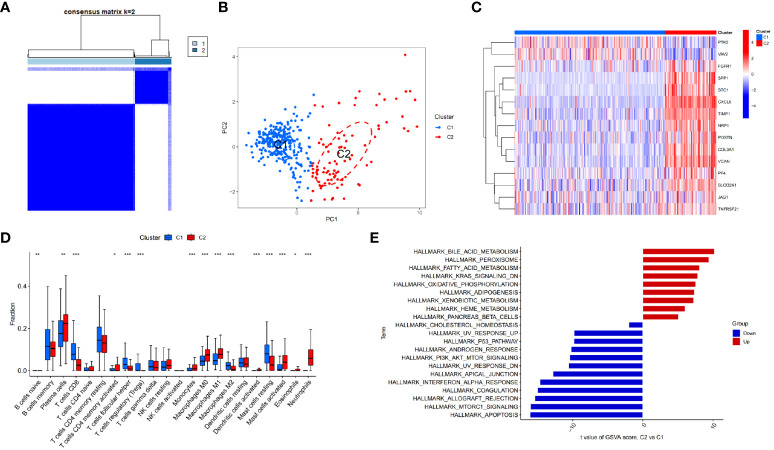
Figure 3.
Identifying different clusters of Crohn’s disease. (A) Consensus matrix of Crohn’s disease samples in GSE112366. (B) PCA showing the degree of distinction between different Crohn’s disease clusters (C1 and C2). (C) Heatmap displaying the expression of differentially expressed angiogenesis-related genes in Crohn’s disease clusters (C1 and C2). (D) Immune cell infiltration abundance in C1 and C2 clusters (*p < 0.05, **p < 0.01 and ***p < 0.001). (E) GSVA enrichment analysis of C1 and C2 clusters.

