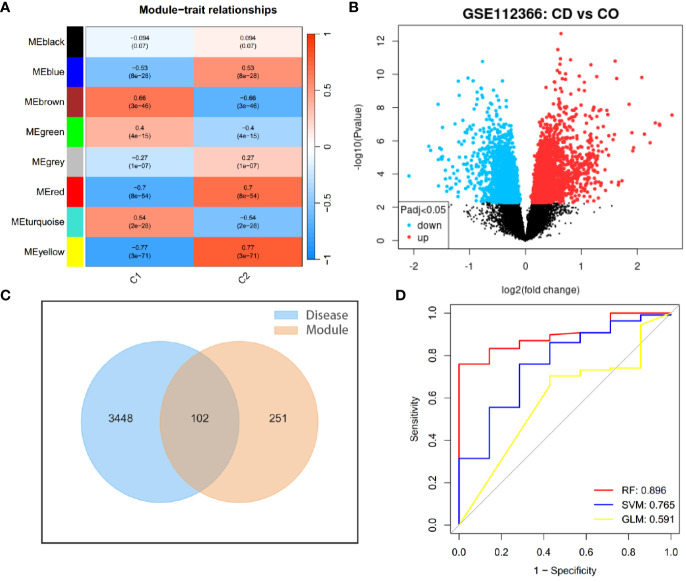
Figure 4.
Identifying genes involved in the development of Crohn’s disease and angiogenesis. (A) WGCNA module trait for C1 and C2 clusters. (B) Volcano plot showing gene expression differences between Crohn’s disease samples and controls. (C) Intersection of differentially expressed genes between CD samples (Disease) and controls with characteristic module genes of CD clusters (Module). (D) ROC curves illustrating the diagnostic performance of three machine learning algorithms for the disease.

