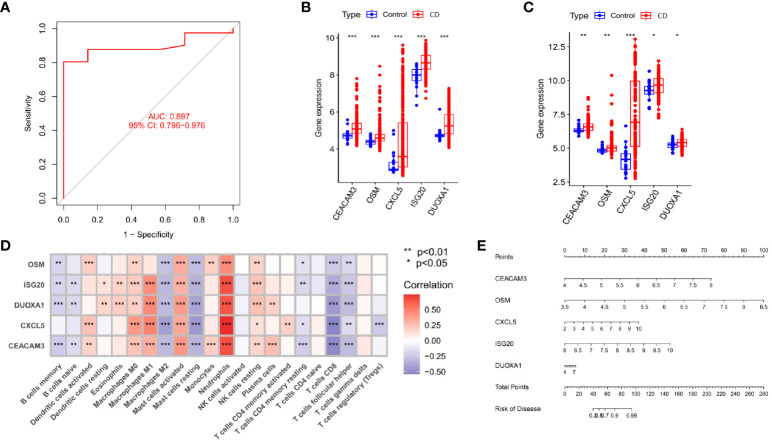
Figure 5.
Identification of hub genes and construction of diagnostic models. (A) Validation of the diagnostic performance of hub genes in GSE186582. (B, C) Differential expression of hub genes between Crohn’s disease patients and controls in GSE112366 (B) and GSE186582 (C) (*p < 0.05, **p < 0.01 and ***p < 0.001). (D) Correlation between hub genes and immune cell infiltration abundance (***p < 0.001). (E) Nomogram for the diagnosis of Crohn’s disease.

