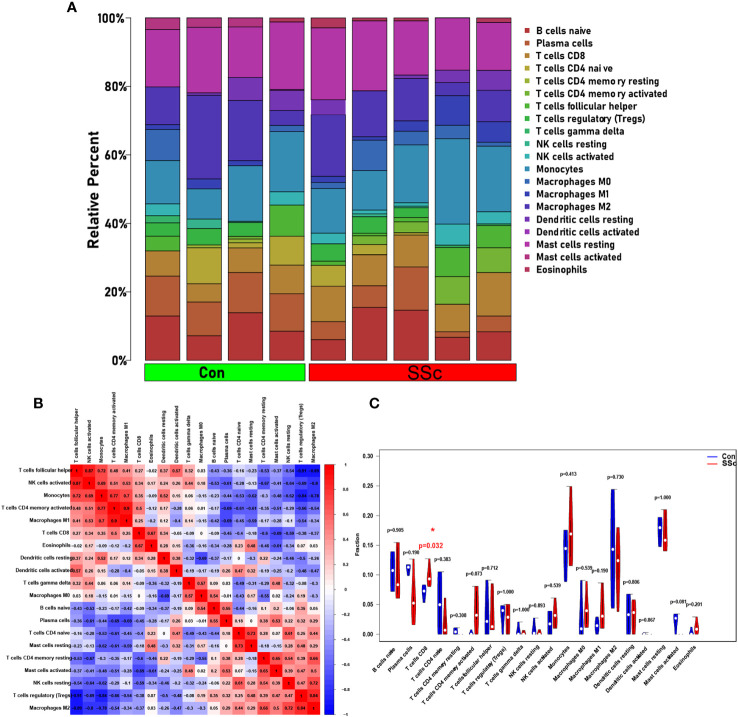
Figure 7.
Immune infiltration in skin of BLM-induced SSc tree shrew model. (A) A heatmap was generated to visualize the expression levels of 20 distinct immune cell types across four control samples and five systemic sclerosis samples. (B) To assess the matrix encompassing 20 distinct immune cell categories, Pearson correlation coefficient analysis was performed. (C) The immune cell compositions between BLM-induced SSc tree shrew and control skin samples.

