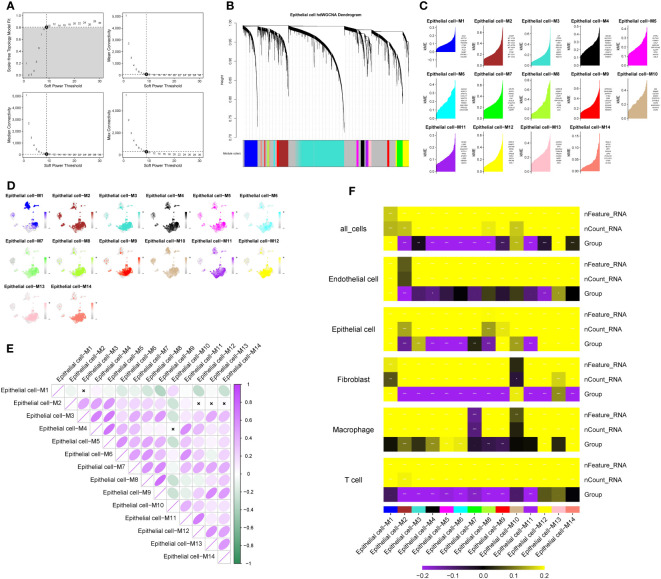
Figure 2.
Identification of key modules in pancreatic cancer liver metastasis based on hdWGCNA. (A) Soft-threshold selection process, 9 is the optimal soft-threshold for constructing a co-expression network with a scale-free network structure. (B) Dendrogram visualizing the hierarchical structure of the co-expression network, where each module color represents a distinct module. (C) Fourteen modules highly correlated with pancreatic cancer liver metastasis and their central genes. (D) Enrichment of module genes at the single-cell level, with darker colors indicating high enrichment of module genes in specific cell subtypes. (E) Inter-module correlation analysis, showing the strength of correlation between each module and all other modules. Purple indicates positive correlation, green indicates negative correlation. Darker colors represent stronger correlation, while white indicates no significant association between two modules. (F) Heatmap illustrating the correlation between modules and pancreatic cancer liver metastasis. Colors represent the strength of correlation, with yellow indicating positive correlation and purple indicating negative correlation. The intensity of the color reflects the strength of the correlation. represents P<0.1, * represents P<0.05, ** represents P<0.01, *** represents P<0.001.

