Figure 7.
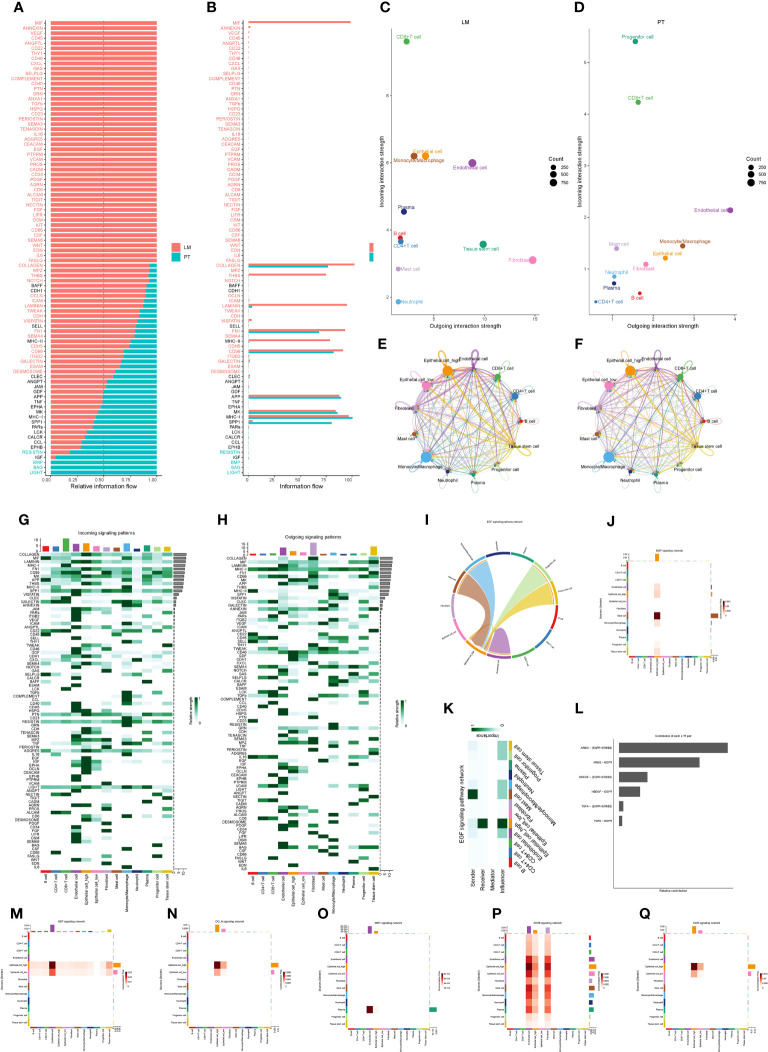
Cell communication network reveals significant role of high PAK2 expression cancer cells in liver metastasis. (A, B) Cell communication networks in pancreatic cancer primary and liver metastasis show significant differences in signaling communication. (C, D) Pancreatic cancer cells exhibit similar outgoing communication in primary and liver metastasis, while the incoming communication shows a larger difference in liver metastasis. (E, F) Interaction quantity and interaction weight/strength of various cells in the pancreatic cancer tumor microenvironment (TME) in the communication network. (G, H) Contribution of various cells in the pancreatic cancer TME as signal senders and receivers to various signaling pathways. (I-L) Specific analysis results of the EGF signaling pathway. (I) Sine wave graph of cell communication in the EGF signaling pathway. (J, K) Contribution heatmap of each cell communication in the EGF signaling pathway. (L) Receptor with the most frequent communication in the EGF signaling network. (M-Q) Contribution heatmap of cell communication in various signaling pathways, including GDF, OCLN, WNT, CD46, and CDH.

