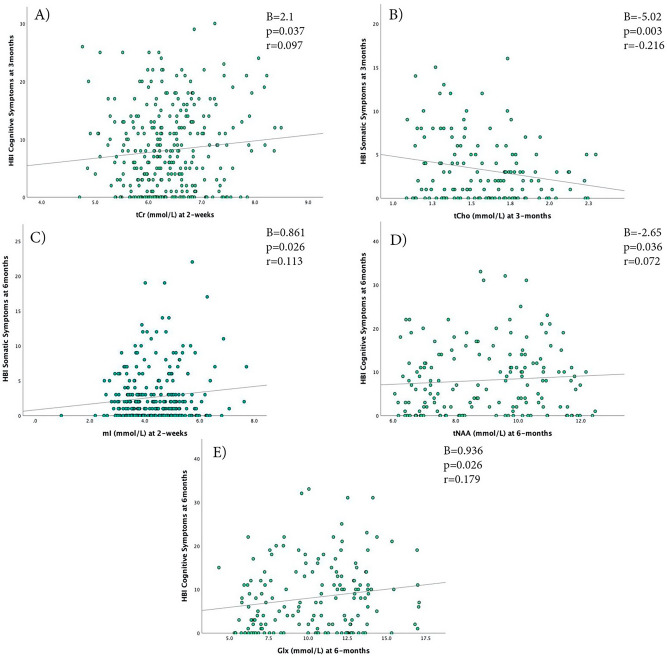
Figure 6.
Scatterplot of the relationship of the metabolite concentrations that were found to have significant associations with HBI symptoms (Cognitive/Somatic) at 12 days, 3 months, and 6 months. (A) 12 day tCr levels and cognitive symptoms at 3 months, (B) 3 month tCho levels and somatic symptoms at 3 months, (C) 12 day mI levels and somatic symptoms at 6 months, (D) 6 month tNAA levels and 6 month cognitive symptoms, (E) 6 month Glx levels and 6 month cognitive symptoms.

