
Fig. 4. Virological characteristics of XBB.1.5 in vitro.
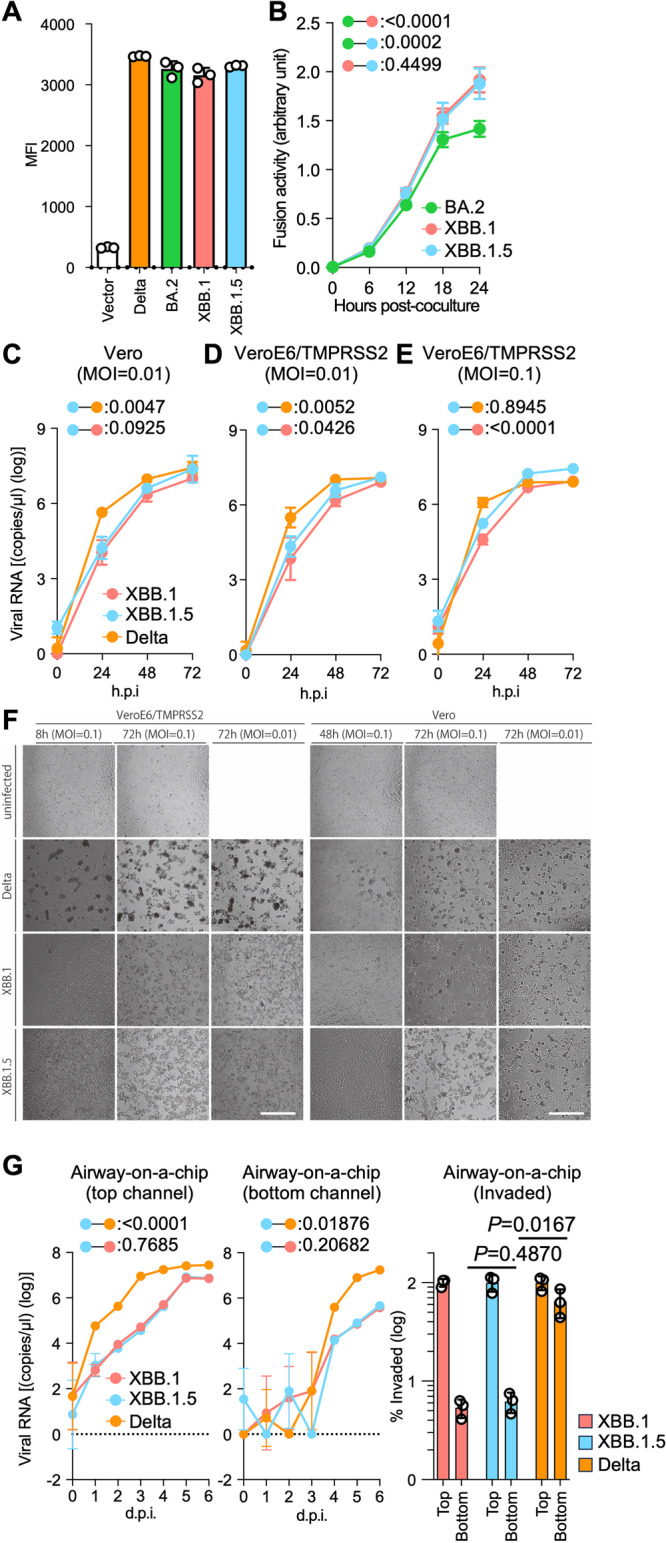
SARS-CoV-2 S protein-mediated membrane fusion assay in Calu-3/DSP1-7 cells. Surface S protein expression level in transfected HEK293 cells (A). Fusion activity (arbitrary units) of the BA.2, XBB.1, and XBB.1.5 S proteins are shown (B). Growth kinetics of XBB.1.5. Clinical isolates of Delta, XBB.1, and XBB.1.5 were inoculated into Vero cells (C) and VeroE6/TMPRSS2 cells (D and E). The copy numbers of viral RNA in the culture supernatant (C–E) were routinely quantified by RT-qPCR. (F) The cells were observed under microscopy to judge the CPE appearance. Scale bar: 500 μm. (G) Clinical isolates of XBB.1, XBB.1.5, and Delta were inoculated into an airway-on-a-chip system. The copy numbers of viral RNA in the top (left) and bottom (middle) channels of an airway-on-a-chip were routinely quantified by RT-qPCR. On the right, the percentage of viral RNA load in the bottom channel per top channel at 6 d.p.i. (i.e., % invaded virus from the top channel to the bottom channel) is shown. Assays were performed in triplicate (A, G) or quadruplicate (B–F). The presented data are expressed as the average ± SD (A, B) or SEM (C–G). Statistically significant differences versus XBB.1 across timepoints were determined by multiple regression (B-E and G left) or a two-sided Student’s t test (G right). The FWERs calculated using the Holm method are indicated in the figures. NA, not applicable.