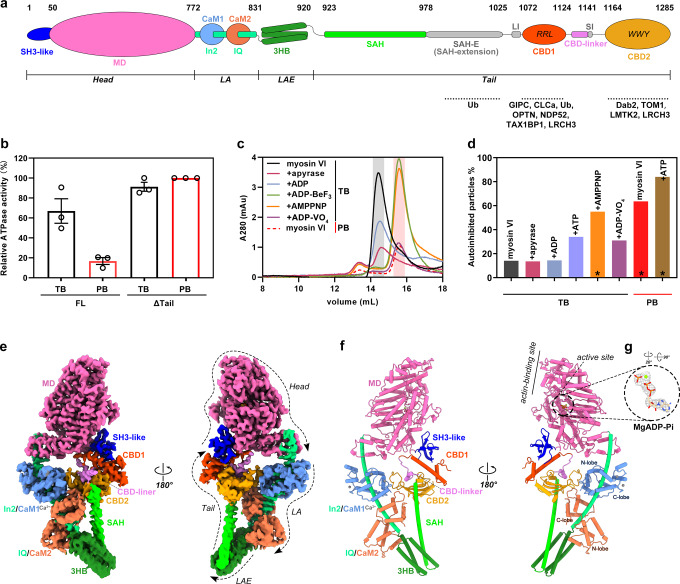
Fig. 1. Overall structure of myosin VI in the autoinhibited state.
a Schematic domain organization of myosin VI. Two CaM molecules are depicted binding to specific regions in myosin VI. Two essential cargo-binding motifs of RRL and WWY in CBD1 and CBD2, respectively, are highlighted with their corresponding cargos/cargo adapters indicated. The color code used here is applied throughout the manuscript. b ATPase activities of myosin VI and its tail-deleted mutant measured in TB and PB. The measured activity of the ΔTail mutant in PB is used to indicate 100 % activation of myosin VI and other samples are normalized to it for comparison. All the reactions were experimentally repeated three times and all data are presented as mean values ± SEM in this and the following measurements of ATPase activity. c aSEC profiles of myosin VI samples in different nucleotide and buffer conditions. The elution volume for autoinhibited and open myosin VI is indicated with red and gray color, respectively. The samples in TB were prepared either without additive or with an additional 8 U/mL apyrase, 1 mM ADP/ATP, or 1 mM ATP analogs. The samples in PB were prepared by exchanging buffer from TB to PB. d Percentage of autoinhibited particles of myosin VI in indicated conditions analyzed by cryo-EM. The samples were prepared with similar treatments in panel (c) and three samples marked with stars were used for cryo-EM structure determination. e Cryo-EM map of myosin VI in the autoinhibited state, highlighting its domains and two CaM molecules. The overall extension direction of the head, LA, LAE, and tail regions is indicated. Map contour level = 0.1. f Atomic model of autoinhibited myosin VI. The active site and actin-binding site in the MD and the N/C-lobe in the CaM molecules are labeled. Four Ca2+ ions binding to CaM1 are depicted as gray spheres. g Density map of MgADP-Pi at the active site, with its structure overlapped. Map contour level = 0.1.

