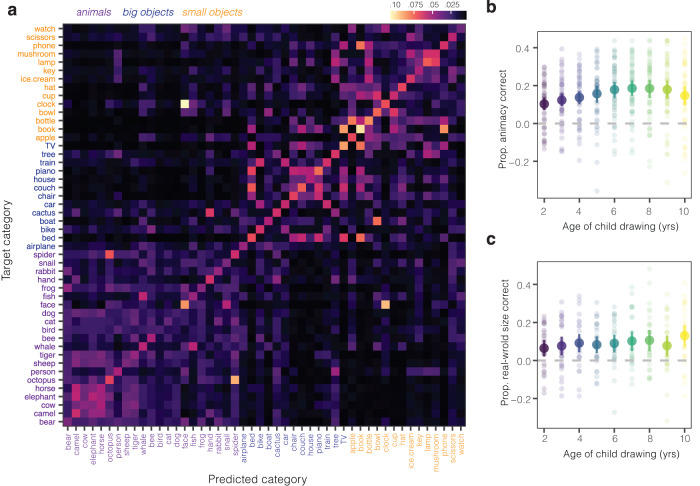
Fig. 3. Semantic information in misclassified drawings.
a Classifier probabilities for the subset of drawings that were misclassified on the basis of VGG-19 embeddings (FC6) (N = 13682 misclassified drawings produced by N = 6270 children, with 48 probabilities for each drawing). The y-axis shows the category children were intending to draw; the x-axis shows all of the categories in the dataset. Lighter values represent greater classifier probabilities assigned to a given category (see colorbar). b, c Proportion of misclassified drawings that contained the correct animacy/object size information of the target category (relative to baseline in the dataset); each dot represents the proportion of drawings in a given category that had correct animacy/real-world size information relative to baseline at each age, respectively. Error bars represent bootstrapped 95% confidence intervals across b N = 48 categories at each age (N = 13682 drawings total), and c across N = 26 inanimate categories at each age (N = 6772 drawings total).

