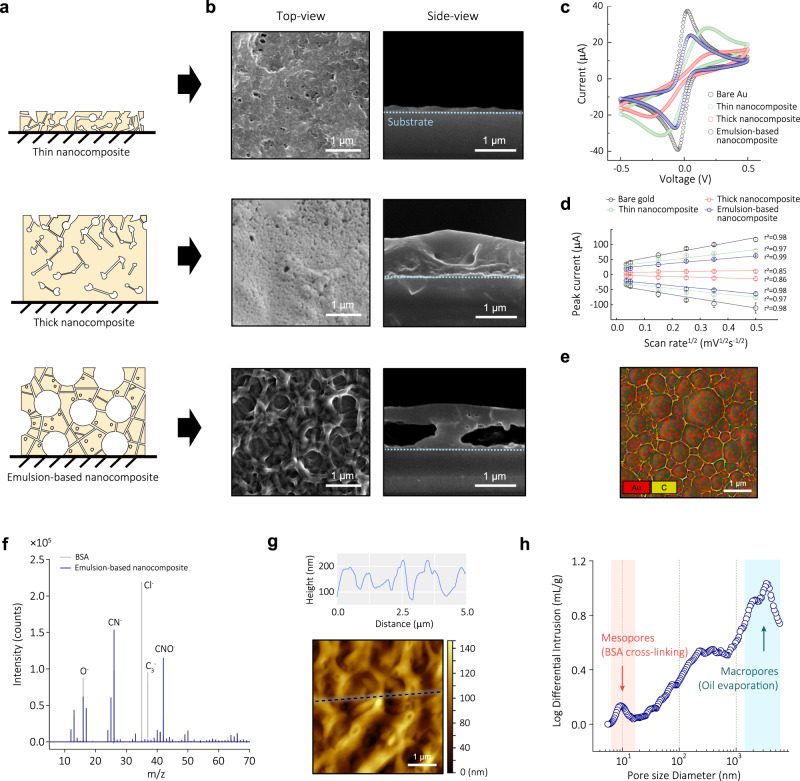
Fig. 2. Characterization of cross-linked nanocomposites.
a Schematic of three different cross-linked BSA nanocomposites: thin, thick, and porous emulsion-based nanocomposites. b Top- and side-view SEM images of nanocomposites. Three nanocomposites exhibited dense coatings with corresponding thicknesses and porosities. Data reproducibility was confirmed by three independent experiments. c Representative CV data in 5 mM ferri-/ferrocyanide solution with three nanocomposites and bare Au electrode. Scan rate is 0.1 V s−1 between −0.5 V and 0.5 V. d Oxidation and reduction peak current versus the square root of scan rate (from 0.07 to 1.0 V s−1). Data represents as mean values ± SD (n = 4 independent experiments). e Energy dispersive analysis (EDS) map for Au and C in emulsion-based nanocomposite. f Negative TOF-SIMS spectra with emulsion coating. y-axis denotes the detected number of secondary ions and x-axis denotes the mass-to-charge (m/z) ratio. CN- and CNO- signals were predominantly presented, indicating abundance of the peptide backbone in the emulsion-based nanocomposite. g AFM topography of porous nanocomposite (bottom) and the extracted height profile of black dotted line (top). Data reproducibility was confirmed by two independent experiments. h Measurement of porosity via MIP. Emulsion-based nanocomposite has mesopores with an average size of 9.53 nm between the macropores with an average size of 1.123 μm.

