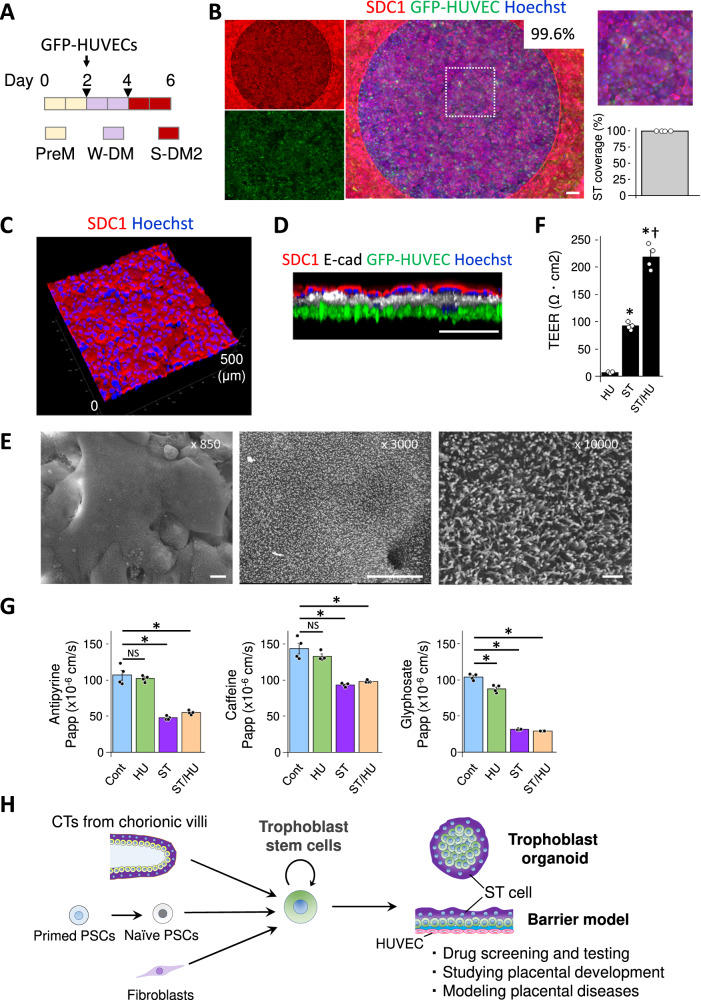
Fig. 5. ST/HUVEC co-culture barrier models and translocation of drugs.
A The strategy of co-culture for ST/HUVEC models. Triangular marks indicate medium exchange. B ST/HUVEC models were generated according to the strategy shown in Fig. 5A. Immunostaining of SDC1. The right panel shows a partially magnified image taken using BZ-X800/810. The average ST coverage was 99.6 ± 0.0973% (mean ± SE, N = 4). ST/HUVEC models in a perspective view (C) and in a side view (D) by confocal microscopy with TCS SP8 (Leica). E Scanning electron microscopy images of a ST/HUVEC barrier model. F TEER measurements in each barrier model (N = 4). *P < 0.05, Dunnett’s test. †P < 0.05, Student’s t test (ST vs. ST/HUVEC). Data are shown as mean ± SE. G The permeability of reference compounds in control (Cont, collagen membrane), HUVEC (HU), ST, and ST/HUVEC (ST/HU) models (N = 4). *P < 0.05, Dunnett’s test. Data are shown as mean ± SE. H Potential applications of human trophoblast organoids and ST barrier models. The scale bars indicate 200 μm (B), 200 μm (D), 10 μm (E, ×850 and ×3000), or 1 μm (E, ×10,000). Data of ST or ST/HUVEC models were obtained from the models of day 6. F, G N refers to replicates (biologically independent samples).

