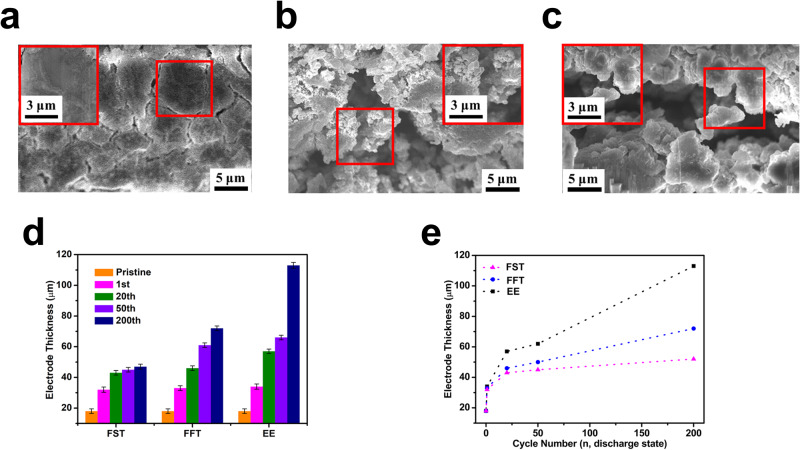
Fig. 7. Morphology of Si particles and electrode thickness after cycling.
Focused ion beam (FIB) cross-section SEM images of the SiMP electrodes after 200 cycles of operation in different electrolytes. The insets show the red-square highlighted area with enlarged resolution. a FST. b FFT. c EE. The electrode thickness evolution during the cycling with various electrolytes. d The histogram of thickness evolution in the three electrolytes, the error bar is defined as the average reading error from the electrode thickness measurement. e The SiMPs expansion trend. The dashed line here is only for the guidance of the eye. The Li||μSi cells are cycled to a specific cycle and then stopped at the charged state to make these ex-situ measurements, detailed cross-section images can be found in Supplementary Figs. 23–26. Source data are provided as a Source Data file.

