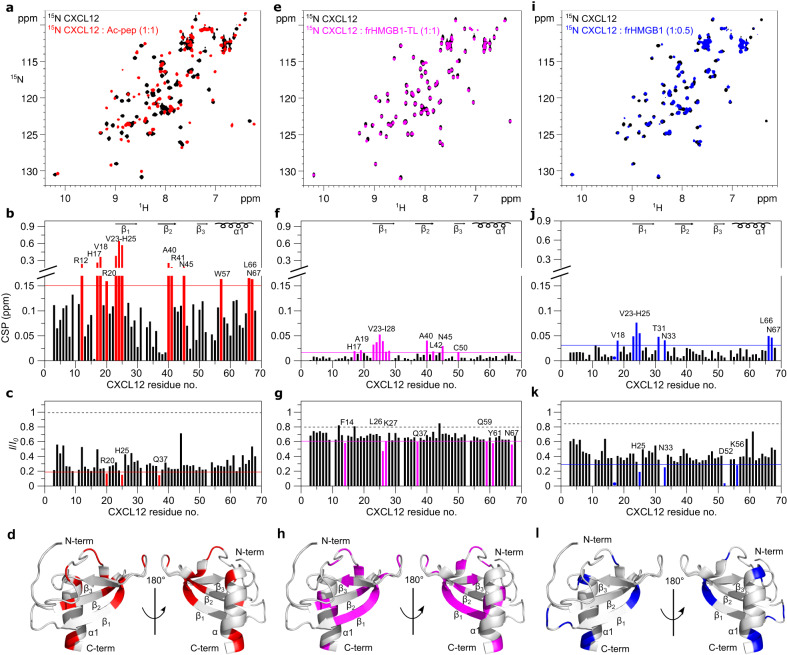
Fig. 2. Ac-pep, frHMGB1-TL and frHMGB1 interact with CXCL12 dimerization surface.
a Superposition of 1H-15N HSQC spectra of 15N CXCL12 (0.1 mM) without (black) and with (red) Ac-pep (1:1). Bar graph showing (b) residue-specific chemical shift perturbation (CSPs) and c peak intensities ratios (I/I0) of 15N-labeled CXCL12 (0.1 mM) upon addition of Ac-pep (1:1). Residues with CSP > avg + σ0 (corrected standard deviation, red line) and with I/I0 <avg - SD (standard deviation, red line) are labeled and (d) shown in red on CXCL12 (gray cartoon, pdb code: 2KEE). e Superposition of 1H-15N HSQC spectra of 15N CXCL12 (0.1 mM) without (black) and with (magenta) frHMGB1-TL (1:1). Bar graph showing (f) residue-specific CSPs and (g) I/I0 of 15N-labeled CXCL12 (0.1 mM) upon addition of frHMGB1-TL (1:1) of 15N-labeled CXCL12 (0.1 mM). Residues with CSP > avg + σ0 (magenta line) with I/I0 <avg - SD (magenta line) are labeled and (h) shown in magenta on CXCL12. i Superposition of 1H-15N HSQC spectra of 15N CXCL12 (0.1 mM) without (black) and with (blue) frHMGB1 (1:0.5). Bar graph showing (j) residue-specific CSPs and (k) I/I0 of 15N-labeled CXCL12 (0.1 mM) upon addition of frHMGB1 (1:0.5). Residues with CSP > avg + σ0 (blue line) and I/I0 < avg - SD (blue line) are labeled and (l) shown in blue on CXCL12. In the bar graphs α-helices and β-strands are schematically represented on the top, missing residues are prolines, dots indicate residues disappearing upon binding, the dashed black line indicates the expected peak intensity decrease due to the titration dilution effect. Source data are provided as a Source Data file.

