
Fig. 4. The acidic IDR peptide (15N Ac-peprec) dynamically interacts with CXCL12.
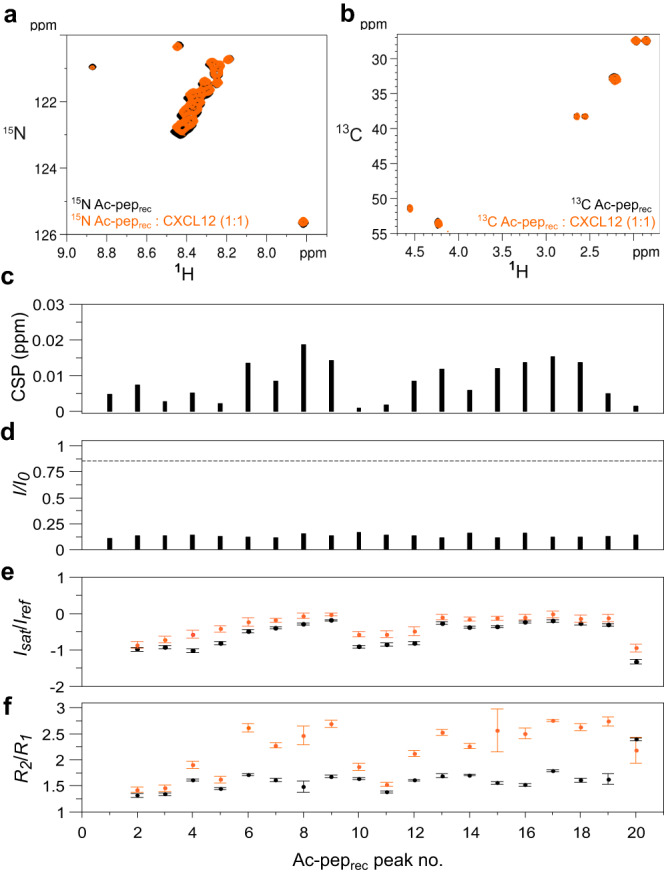
Superposition of (a) 1H-15N HSQC spectra of 15N Ac-peprec (0.1 mM) without (black) and with (orange) CXCL12 (1:1), (b) 1H-15C HSQC spectra of 15N/13C Ac-peprec (0.1 mM) without (black) and with (orange) CXCL12 (1:1). Bar graphs showing (c) chemical shift perturbation (CSPs) and (d) peak intensity ratios (I/I0) of 15N Ac-peprec (0.1 mM) upon addition of CXCL12 (1:1). e Peak intensity ratios of heteronuclear NOE with and without proton saturation (Isat/Iref), error bars were calculated by error propagation from the standard deviation (SD) of the average value of the noise in the saturated and non saturated reference spectra. f Ratios of R2 and R1 relaxation rates of 15N Ac-peprec (0.1 mM) without (black) and with CXCL12 (1:1) (orange). Data of one representative experiment performed on n = 2 biologically independent samples are presented as mean values +/− SD. Error bars are derived from relaxation data as described in methods. Amide resonances were not sequence specifically assigned and peaks were attributed arbitrary numbers. Source data are provided as a Source Data file.