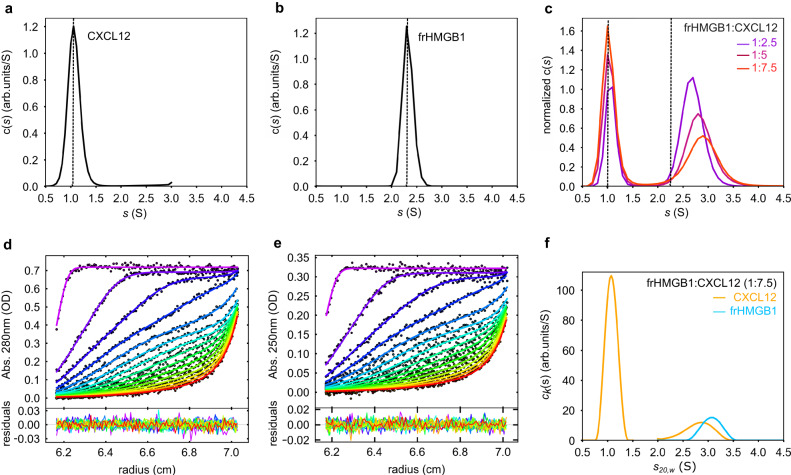
Fig. 6. frHMGB1 and CXCL12 form a transient 1:1 heterocomplex.
Sedimentation coefficient distributions c(s) of (a) free CXCL12 (38.2 µM) and (b) frHMGB1 (15.6 µM), scanned by absorbance at 280 nm. c Overlay of normalized c(s) showing the interaction between frHMGB1 (7.8 µM) and increasing concentrations of CXCL12 (colors). The dotted lines indicate the sedimentation coefficients of the free components. d, e Global multi-signal sedimentation velocity analysis to determine the stoichiometry of frHMGB1:CXCL12 complex, with 7.7 µM frHMGB1 and 43 µM CXCL12. The raw sedimentation signals of frHMGB1:CXCL12 mixture acquired at different time points with (d) absorbance at 280 nm, and (e) absorbance at 250 nm with the corresponding signal profiles as a function of radius in centimeters. The time-points of the boundaries are indicated in rainbow colors, progressing from purple (early scans) to red (late scans). Only every 3rd scan used in the analysis are shown. Residuals of the fit are shown at the bottom. f Decomposition into the component (k) sedimentation coefficient distributions, ck(s), for CXCL12 (yellow line) and frHMGB1 (cyan line). Source data are provided as a Source Data file.

