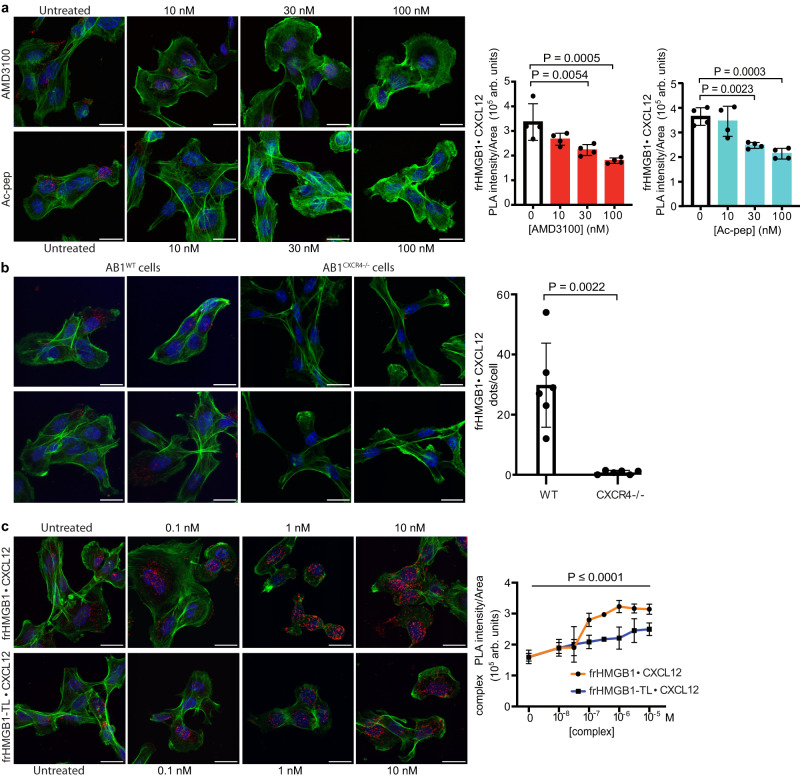
Fig. 8. The acidic IDR modulates frHMGB1•CXCL12 binding to CXCR4 on AB1 cells.
a Representative confocal microscopy images of Proximity Ligation Assays (PLAs) performed on the frHMGB1•CXCL12 complex on the surface of AB1 malignant mesothelioma cells. Cells were either untreated or treated with AMD3100 or Ac-pep (light blue bars) for 1 h at 37 °C/5% CO2 at three different concentrations (10, 30, or 100 nM). PLA signal was quantified as described in the Methods section. Mean ± SD are indicated; n = 4 FOV (field of view) per concentration. One-way ANOVA was performed comparing AMD3100 (red) and Ac-pep (light blue) treated cells to untreated cells (white); AMD3100 versus untreated: **P = 0.0054; ***P = 0.0005; Ac-pep versus untreated: **P = 0.0023, ***P = 0.0003. Data are presented as arbitrary units (arb. units). Scale bar; 20 μm. b Representative confocal microscopy images of PLAs performed on the frHMGB1•CXCL12 complex on the surface of either wild type (WT) or Cxcr4 knockout (Cxcr4−/−) AB1 malignant mesothelioma cells. PLA signal was quantified as number of dots per cell in FOV. Statistical analysis; two-tailed, non-parametric Mann–Whitney test. Mean ± SD are indicated; n = 6 FOV per condition. Data are presented as arbitrary units (arb. units). Scale bar; 20 μm. c PLA signal quantification on the surface of ligand-stripped AB1 cells exposed at 4 °C to increasing concentrations of either frHMGB1•CXCL12 or frHMGB1-TL•CXCL12 equimolar heterocomplexes. Data are presented as arbitrary units (arb. units). Mean ± SD are indicated; n = 4 FOV per concentration. The difference between frHMGB1•CXCL12 (orange) and frHMGB1-TL•CXCL12 (blue) heterocomplexes is statistically significant (P < 0.0001) by two-way ANOVA. Sidak’s multiple comparisons test revealed statistically significant differences between frHMGB1•CXCL12 and frHMGB1-TL•CXCL12 at the following concentrations; 10−7 M: P = 0.0004, 10−6.5 M, P = 0.0003, 10−6 M: P < 0.0001, 10−5.5 M: P = 0.0013, and 10−5 M: P = 0.0032. In all panels, nuclei are in blue (Hoechst 33342), phalloidin is in green, and the frHMGB1•CXCL12 PLA signal is red. Scale bar; 20 μm. Source data are provided as a Source Data file.

