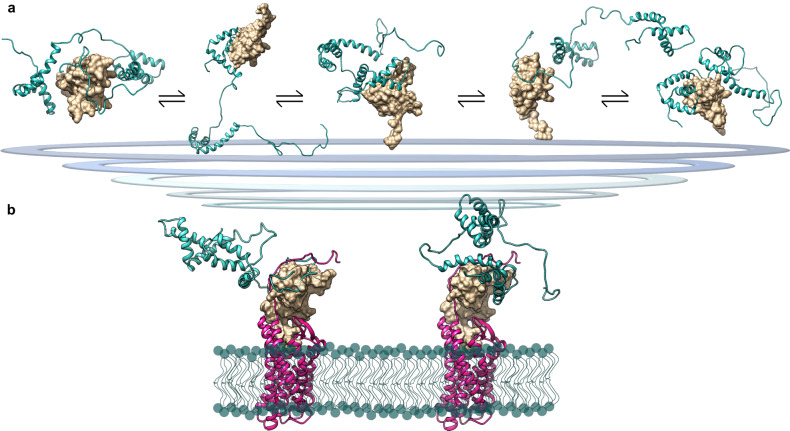
Fig. 9. Model of frHMGB1•CXCL12 fuzzy complex.
a Representative EOM models of the fuzzy interactions between frHMGB1 (cyan cartoon) and CXCL12 (gold surface). b Explicative representations of possible different frHMGB1•CXCL12 conformations bound to CXCR4. Two SAXS-EOM frHMGB1•CXCL12 models have been superimposed on the theoretical model of CXCL12 in complex with CXCR485, with CXCR4 in magenta, CXCL12 in gold surface and frHMGB1 in cyan; the lipid bilayer is represented with cyan spheres and lines.

