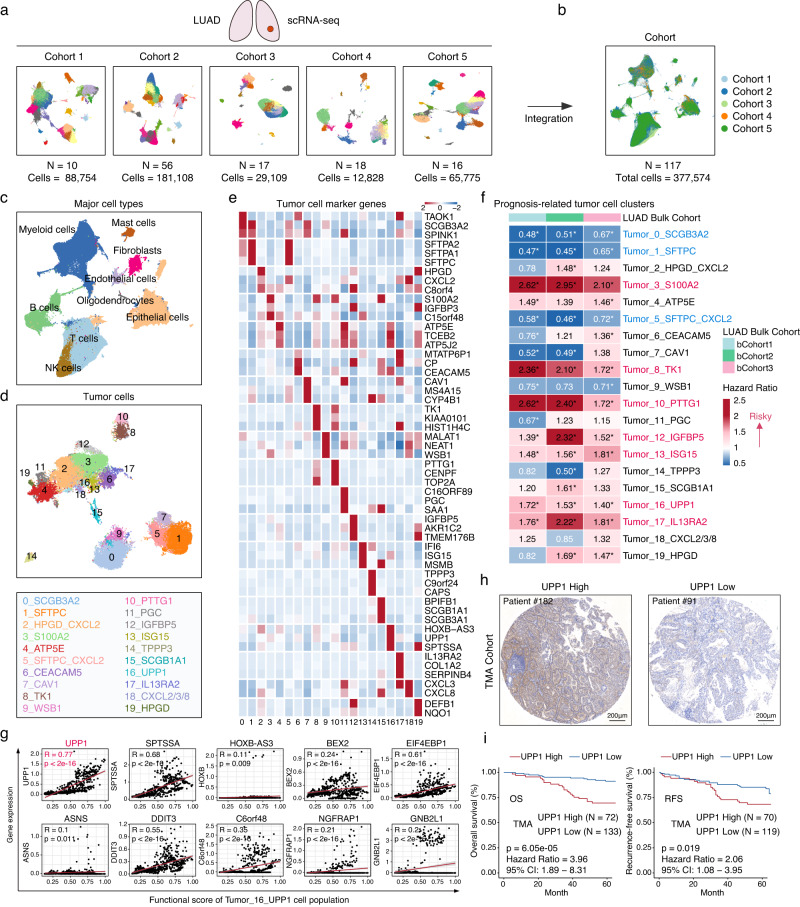
Fig. 1. Integration of LUAD scRNA-seq data and identification of prognostic-related tumor cell populations.
a scRNA-seq data from five LUAD cohorts. Cohort 1 (10 samples, 88,754 cells), Cohort 2 (56 samples, 181,108 cells), Cohort 3 (17 samples, 29,109 cells), Cohort 4 (18 samples, 12,828 cells), Cohort 5 (16 samples, 65,775 cells). b 117 patient samples and 377,614 cells were included for subsequent analysis. The Uniform Manifold approximation and Projection (UMAP) plot showing the cell distribution. c The UMAP plot showing the major cell populations. d The UMAP plot displaying tumor cell clusters. 20 distinct tumor cell clusters were identified (top). The top marker gene for each of these clusters is presented (bottom). e The heatmap showing the mean expression of the top three marker genes for the 20 tumor cell clusters. f The prognostic (overall survival) association of each tumor cell cluster. The number in the heatmap representing the hazard ratio for each tumor cell cluster. A hazard ratio greater than 1 (shown in red) suggested that the cell cluster was associated with poor prognosis. Conversely, a hazard ratio less than 1 (shown in blue) suggested that patients with a relatively higher proportion of this cell cluster tended to have a better prognosis. The asterisk (*) indicated p < 0.05. If the cell clusters consistently exhibited either an association with poor prognosis or a trend towards a better prognosis in all three bulk cohorts, the names of these cell clusters were highlighted: red indicating an association with poor patient prognosis, blue suggesting a relatively better prognosis. Statistical analysis was conducted using log-rank tests. g In Tumor_16_UPP1 tumor cell cluster, the correlations between the expression levels of the top 10 marker genes and the functional score of the enriched biological processes. The correlation analysis was conducted using the two-tailed Pearson’s correlation. h Representative IHC staining images of UPP1 in our tissue microarray (TMA) cohort from Zhongshan Hospital (n = 205). Scale bars = 200 μm. i Kaplan–Meier overall survival and recurrence-free survival curves of UPP1 expression in our TMA. OS analysis (n = 205). RFS analysis (n = 189). Statistical analysis was conducted using log-rank tests. Source data are provided as a Source Data file.

