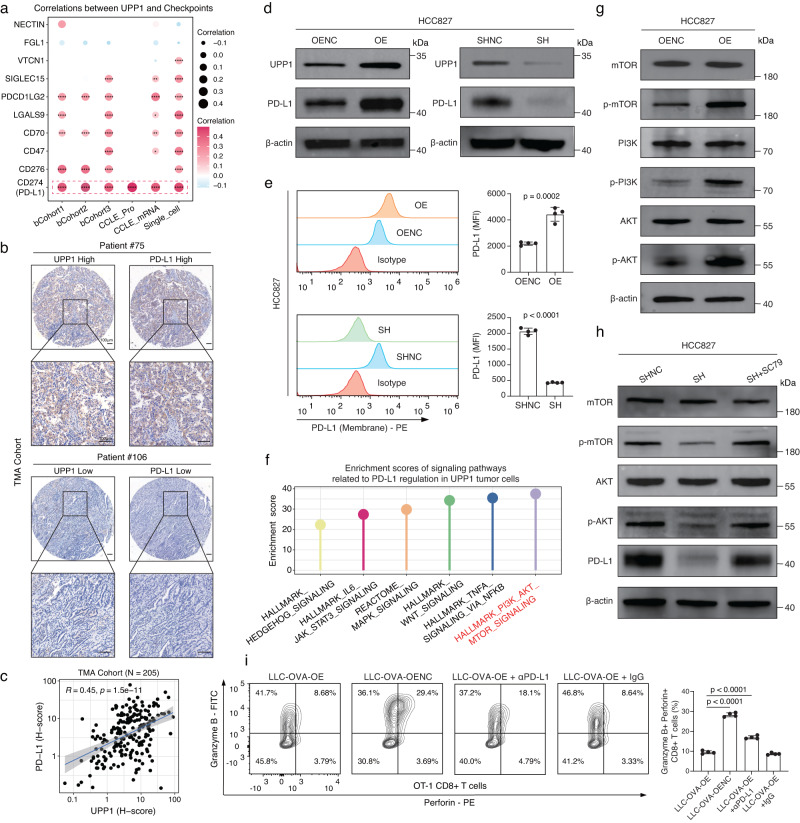
Fig. 4. UPP1 regulates PD-L1 expression via PI3K/AKT/mTOR pathway.
a Two-tailed Pearson correlation analysis between UPP1 and immune checkpoints across different datasets, including the scRNA-seq dataset (cells = 49,113), bulk datasets (bCohort1, n = 559; bCohort2, n = 398; bCohort3, n = 572), and CCLE mRNA (n = 440) and protein expression (n = 37) datasets. *p < 0.05, **p < 0.01, ***p < 0.001, ****p < 0.0001. b Representative images of IHC staining of UPP1 and PD-L1 in our TMA cohort from Zhongshan Hospital (n = 205). Scale bars = 100 μm. c Two-tailed Pearson correlation between UPP1 and PD-L1 in our TMA cohort (n = 205). Data are presented as mean ± SEM. d Western blot analysis of PD-L1 expression in HCC827 tumor cells with UPP1 overexpression (OE) or UPP1 knockdown (SH). Representative images shown (n = 3). e Flow cytometry analysis of PD-L1 expression on the cell surface of HCC827 tumor cells with UPP1 overexpression or UPP1 knockdown. Representative flow cytometry plots are shown (n = 4). Data are presented as mean ± SD. Statistical analysis was conducted using the two-tailed student’s t-test. MFI, mean fluorescence intensity. f Functional enrichment analysis of six classical signaling pathways known to regulate PD-L1 in UPP1high tumor cells. Pathways were ranked based on ssGSEA enrichment scores. g Western blot analysis of the levels of PI3K, AKT, and mTOR and phosphorylated PI3K, AKT, and mTOR in HCC827 tumor cells with UPP1 overexpression. Representative images shown (n = 3). h Western blot analysis of the levels of phosphorylated AKT and mTOR in HCC827 tumor cells with UPP1 knockdown and after the treatment of SC79 for 48 h (20 µM). Representative images shown (n = 3). i Flow cytometry analysis of immune effector molecules, Perforin and Granzyme B, in OT-1 CD8 + T cells after co-cultured with LLC-OVA UPP1-OE tumor cells, LLC-OVA UPP1-OENC tumor cells, and LLC-OVA UPP1-OE tumor cells with the treatment of PD-L1 antibodies (αPD-L1) or isotype control IgG. Representative flow cytometry plots shown (n = 4). Data are presented as mean ± SD. Statistical analysis was conducted using one-way ANOVA with multiple comparisons. n denotes biologically independent samples. Source data are provided as a Source Data file.

