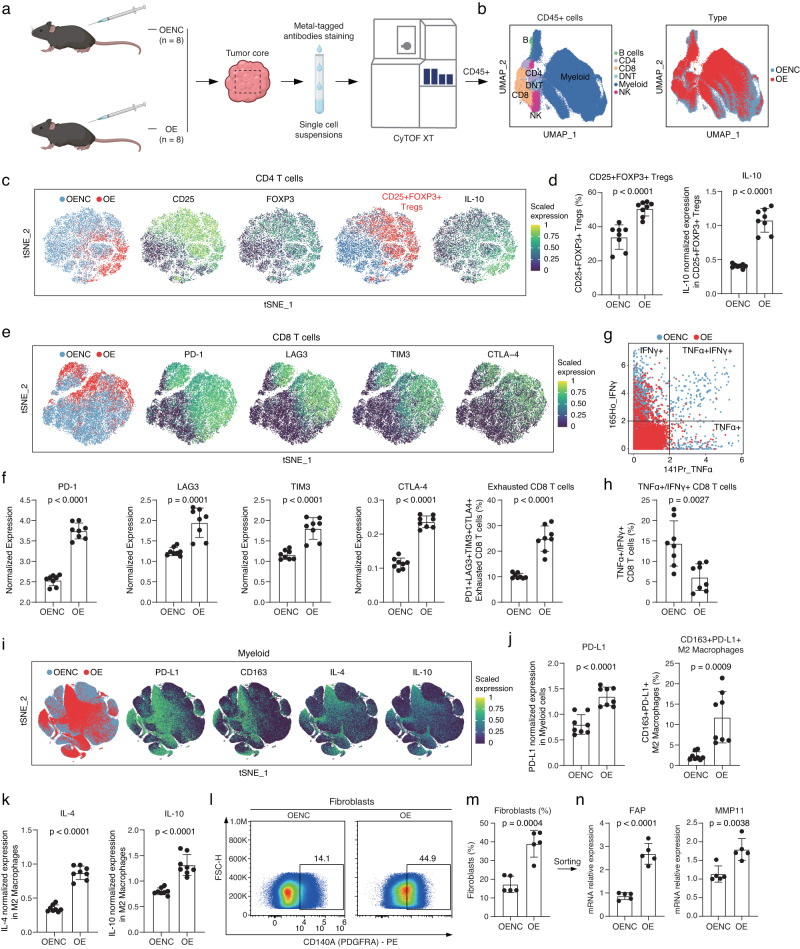
Fig. 5. CyTOF analysis of the alterations in the characteristics of TME in UPP1-overexpressing tumors.
a Experimental flowchart, created with BioRender.com. b UMAP plot showing major cell populations. c tSNE plots of CD4 + T cells. From left to right: The distribution of CD4 + T cells from the UPP1-OE and UPP1-OENC groups; Expression of CD25 and FOXP3 in CD4 + T cells; The CD4 + T cells expressing both CD25 and FOXP3 are labeled as CD25 + FOXP3+ Tregs; Expression of IL-10 in CD4 + T cells. d The proportion of CD25 + FOXP3+ Tregs between the UPP1-OE and UPP1-OENC groups (left). The expression level of IL-10 in CD25 + FOXP3+ Tregs (right) (n = 8). e tSNE plots of CD8 + T cells. From left to right: The distribution of CD8 + T cells from the UPP1-OE and UPP1-OENC groups; Expression of PD-1, LAG3, TIM3, and CTLA4 in CD8 + T cells. f Immune checkpoint expression (left) and proportion of PD1 + LAG3 + TIM3 + CTLA4+ exhausted CD8 + T cells (right) in UPP1-OE vs. UPP1-OENC groups (n = 8). g TNFα + /IFNγ + CD8 + T cells distribution in UPP1-OE vs. UPP1-OENC groups. h Proportion of TNFα + /IFNγ + CD8 + T cells in UPP1-OE vs. UPP1-OENC groups (n = 8). i tSNE plots of the myeloid cells. From left to right: The distribution of myeloid cells from the UPP1-OE group and UPP1-OENC group; Expression levels of PD-L1, CD163, IL-4, and IL-6 in myeloid cells. j PD-L1 expression in all CD11b+ myeloid cells between the UPP1-OE and UPP1-OENC groups (left). The proportion of CD163 + PD-L1 + M2 macrophages between the UPP1-OE and UPP1-OENC groups (right) (n = 8). k IL-4 and IL-10 levels in CD163 + PD-L1 + M2 macrophages between the UPP1-OE and UPP1-OENC groups (n = 8). l LLC tumor cells (UPP1-OE or UPP1-OENC) were subcutaneously injected into C57BL/6 mice. Tumors were then collected for flow cytometry analysis to compare changes in the proportion of fibroblasts (n = 5). m Fibroblast infiltration proportion between the UPP1-OE and UPP1-OENC groups (n = 5). n Fibroblast sorted from (m) for RT-qPCR detection of FAP and MMP11 expression (n = 5). n denotes biologically independent samples. Data were represented as mean ± SD in d, f, h, j, k, and m; mean ± SEM in n. All Statistical analysis were conducted using the two-tailed student’s t-test. Source data are provided as a Source Data file.

