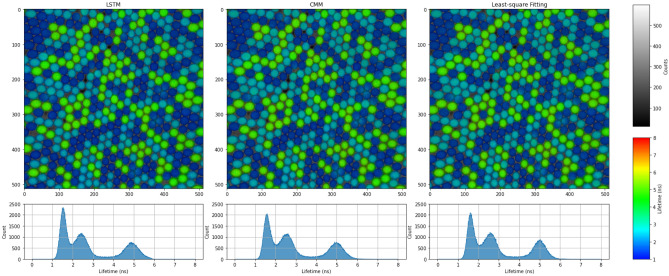
Figure 3.
Comparison of LSTM, CMM, and LS Fitting on experimental data. The sample contains a mixture of fluorescent beads with three different lifetimes (1.7, 2.7, and 5.5 ns). The fluorescence lifetime images are displayed using a rainbow scale, where the brightness represents photon counts and the hue represents lifetimes. The lifetime histograms among all pixels are shown below. Most pixels are assumed to contain mono-exponential fluorophores. Two or three lifetimes might be mixed at the edge of the beads.

