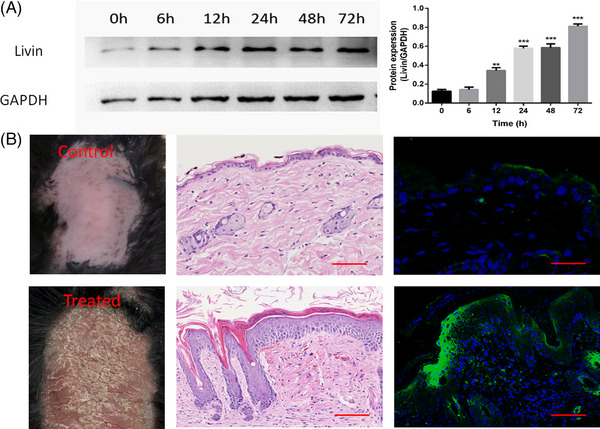
FIGURE 2.

Livin expression was up‐regulated in M5‐Treated HaCaT cells and KCs of IMQ mouse model. (A) Livin was upregulated with time gradient after M5 treatment analysis by western blotting (data are expressed as mean ± SEM and analyzed one‐tail paired Student's t‐test. Differences were considered significant at ** p < 0.01, *** p < 0.001). (B) Livin was up‐regulated in KCs in IMQ treated group than control group analysis by immunofluorescent staining (n = 5). IMQ, imiquimod; KCs, keratinocytes.
