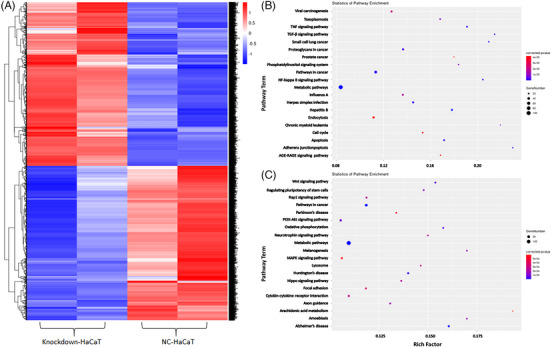
FIGURE 3.

Livin expression could affect the genes in HaCaT cells. (A) Heat map of genes with significant differences of Livin knockdown‐HaCaT compared with NC‐HaCaT analysis by RNA‐seq (Different gene expression levels were indicated by different colors). (B) The KEGG pathway enrichment analysis revealed a close association of Livin with down‐regulated genes. (C) The KEGG pathway enrichment analysis revealed a close association of Livin with up‐regulated genes. KEGG, Kyoto Encyclopedia of Genes and Genomes.
