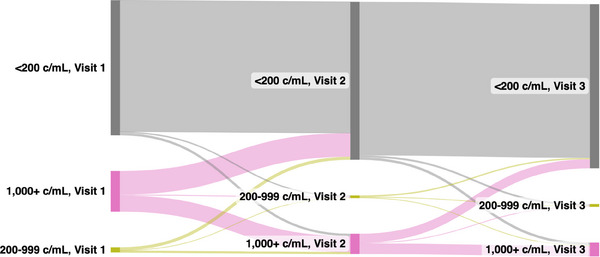
FIGURE 2.

Sankey diagram of person‐level viral load trajectories among participants contributing three visits (two visit‐pairs) to the analytic cohort (N = 1524).
Abbreviation: c/ml, HIV RNA copies/ml.

Sankey diagram of person‐level viral load trajectories among participants contributing three visits (two visit‐pairs) to the analytic cohort (N = 1524).
Abbreviation: c/ml, HIV RNA copies/ml.