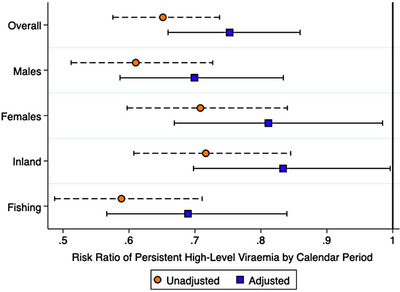
FIGURE 4.

Weighted unadjusted and adjusted risk ratios of persistent high‐level viraemia (≥1000 copies/ml), relative to sustained or new low‐level viraemia or suppression, by calendar period—stratified by sex and community type.
Notes: Risk ratios (RRs) and 95% confidence intervals (95% CI) were estimated from Poisson regression with generalized estimating equations, exchangeable covariance matrices, and robust standard errors. Error bars represent 95% CI for estimated risk ratios of persistent high‐level viraemia. Calendar period represents the survey interval in which a participant's index visit was observed (Oct. 2016–May 2018, referent: Feb. 2015–Sep. 2016). Sustained or new low‐level viraemia or suppression was defined as <1000 copies/ml across visits or at follow‐up only.
