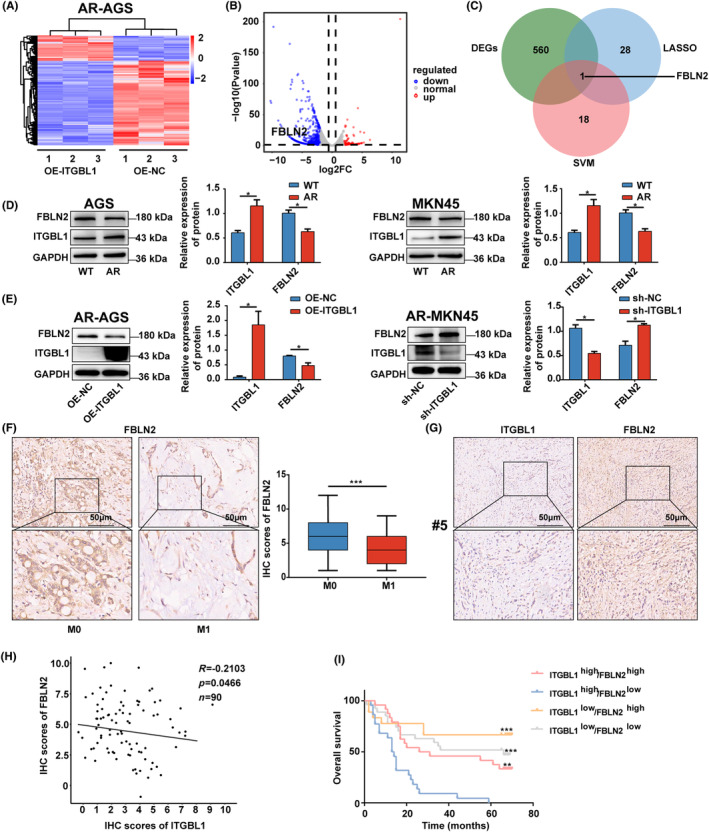
FIGURE 3.

ITGBL1 negatively regulated FBLN2 expression (A). Heatmap of DEGs in AR‐AGS and ITGBL1‐overexpressing AR‐AGS cells after 48 h of suspension culture. (B) Volcano plot of DEGs in AR‐AGS and ITGBL1‐overexpressing AR‐AGS cells after 48 h of suspension culture. (C) Overlap analysis of DEGs between the LASSO technique and SVM algorithm. (D) The protein expression of FBLN2 and ITGBL1 in WT and AR‐GC cells. GAPDH served as a loading control. The quantification of Western blot band densities was performed using the ImageJ program. (E) The protein expression of FBLN2 in ITGBL1‐overexpressing AR‐AGS cells and ITGBL1‐knockdown AR‐MKN45 cells after 48 h of suspension culture. GAPDH served as a loading control. The quantification of Western blot band densities was performed using the ImageJ program. (F) Typical images of stage M0 and M1 GC patients' tissues stained with FBLN2 by IHC. Scale bar, 50 μm. (G) Typical images of ITGBL1 and FBLN2 IHC staining in tissue from GC patient #5 are shown. Scale bar, 50 μm. (H) Correlation analysis between ITGBL1 and FBLN2 expression in GC tissues (R = −0.2103, p = 0.0466). (I) Kaplan–Meier curves of overall survival of GC patients classified into four subgroups based on ITGBL1 and FBLN2 expression. The experiments were conducted in triplicate. The values were represented as means with standard deviations (SD), and the statistical significance was assessed using Student's t‐test. Nonsignificant results were denoted as ‘ns’, while significance levels were shown as *p < 0.05, **p < 0.01, and ***p < 0.001.
