
FIGURE 2.
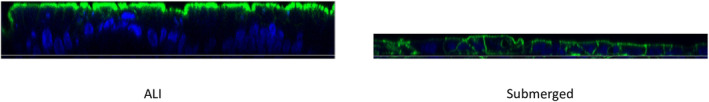
Confocal microscopy images of the monolayer both under ALI conditions (left) and normal conditions(right) stained with FITC phalloidin against F‐actin. The cross‐section of the monolayer under ALI showed a distinct actin‐rich brush border(green) present at the apical side of the monolayer compared to the normal culturing conditions. Scale bar: 25 μm.