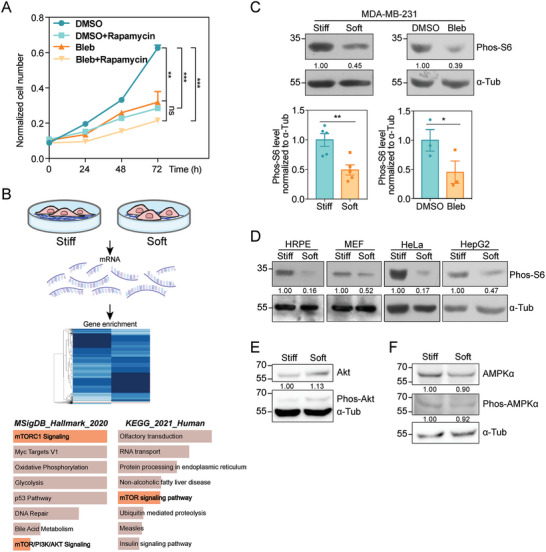
Figure 1.

Substrate stiffness activates mTORC1 pathway to promote cell growth. A) Cell growth curve determined by CCK‐8 assay at 0, 24, 48, and 72 h. Cell number was measured in DMSO and Bleb groups with or without 40 nM Rapamycin treatment (N DMSO = N DMSO+Rapamycin = N Bleb = N Bleb+Rapamycin = 3 independent samples, error bar: mean with SEM, ns = 0.8846, ***p DMSO versus DMSO+Rapamycin = 0.0008, ***p DMSO versus Bleb = 0.0005, **p DMSO versus Bleb+Rapamycin = 0.0015 by one‐way ANOVA for multiple comparison). B) Schematic diagram of RNA‐Seq assay followed by gene enrichment of MDA‐MB‐231 cells plated on stiff or soft substrates. The graphs display the 8 most significantly enriched gene sets based on MSigDB or KEGG database, analyzed with Enrichr and ranked according to combined score. Gene sets related to mTOR signaling were highlighted in light red. C) Top: western blot showing the Phos‐S6 levels in MDA‐MB‐231 cells plated on stiff or soft substrates (left), treated with DMSO or Bleb (right). α‐tubulin is used as loading control. Bottom: quantification of Phos‐S6 levels normalized to α‐tubulin accordingly (Error bar: mean with SEM, *p stiff versus soft = 0.0133 and *p DMSO versus Bleb = 0.0156 by paired Student's t‐test). D) Western blot showing the Phos‐S6 levels in HRPE, MEF, HeLa, HepG2 cells plated on stiff or soft substrates. α‐tubulin is used as loading control. E) Western blot showing Phos‐Akt and total Akt levels in MDA‐MB‐231 cells plated on stiff or soft substrates. α‐tubulin is used as loading control. F) Western blot showing Phos‐AMPKα and total AMPKα levels in MDA‐MB‐231 cells plated on stiff or soft substrates. α‐tubulin is used as loading control.
