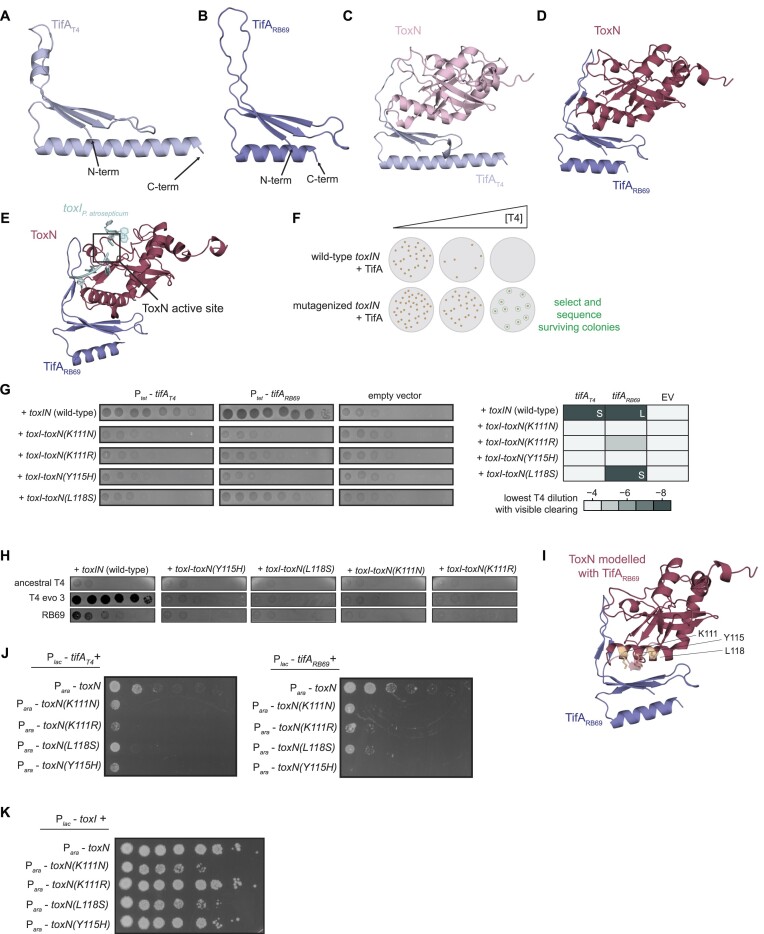
Figure 2.
Prediction and validation of the ToxN-TifA interface. (A, B) AlphaFold model for TifAT4 (A) and TifARB69 (B). (C, D) AlphaFold models for the ToxN-TifAT4 (C) and ToxN-TifARB69 (D) complexes. (E) AlphaFold model for ToxN-TifARB69 with toxIPa and the predicted ToxN active site indicated. The position for toxIPa relative to ToxN was visualized by overlaying the E. coli ToxN predicted structure and the ToxINPa crystal structure (PDB: 2xdd) and is shown to indicate the ToxN active site. (F) Schematic of tab screen used to isolate TifA-resistant ToxN mutants. (G) (Left) Spotting assays for T4 on lawns of +toxIN (either wild-type or mutant toxN) cells with TifAT4, TifARB69, or neither expressed from an anhydrous tetracycline (tet)-inducible promoter during phage infection. (Right) Heatmap quantifying spotting assays, with color indicating the lowest T4 dilution in which the cells displayed visible clearing (either plaques or lower cell density). L and S refer to large and small plaques, respectively, for samples on which T4 formed visible plaques. (H) Spotting assays for wild-type (ancestral) T4, evolved T4 with increased expression of dmd-tifA (T4 evo 3), and RB69 on lawns of +toxIN (with wild-type or mutant toxN) cells. (I) AlphaFold model for the ToxN-TifARB69 complex, with residues K111, Y115 and L118 on ToxN highlighted. (J) Serial dilutions of E. coli cells ectopically expressing toxN (wild-type or mutant) and tifAT4 or tifARB69. (K) Serial dilutions of E. coli cells ectopically expressing toxN (wild-type or mutant) and toxI. Also see Supplementary Figures S3 and S4.

