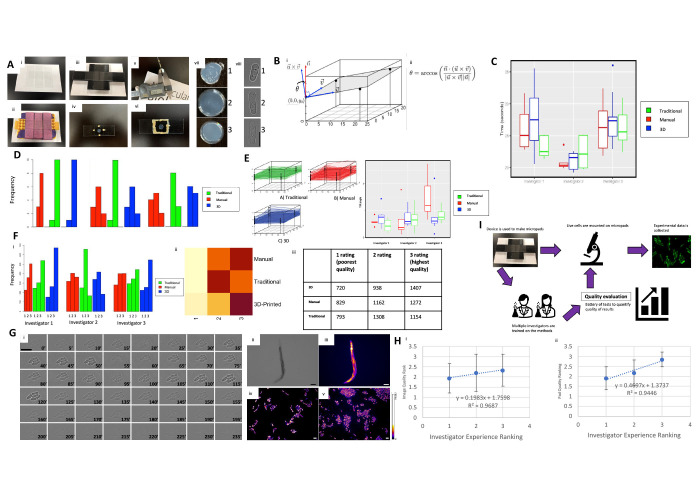
Figure 1. Optimizing agarose gel micropad production and imaging with a 3D printed device and QC method.
A. Agarose gel pad preparation methods and measuring of tilt angle parameters . i) a manual setup, made of two slides laid in parallel, ii) a traditional setup made of a pipette-tip rack and lab tape, iii) a 3D printed micropad maker, iv) a micropad with a coverslip temporarily fixed on the sides with VALAP, v) The digital caliper used to measure the height of each corner of the coverslip, and vi) a micropad with a coverslip sealed on all sides with VALAP, vii) examples of micropads of differing qualities ranked 1-3, where 1 is unusable and 3 is ideal, and viii) examples of imaged cells with different focus qualities ranked 1-3, with 1 being out-of-focus and 3 being ideally focused. Scale bar represents 5 µm in length. B. i) The angle of tilt of the coverslip was calculated using regression and ii) Equation 1. C. The time taken to produce agarose pads. The time taken by three different investigators to make a single agarose pad slide using the manual method (red), a traditional method (green), and the 3D device (blue) (n=11 slides per investigator per method). Investigator 2 was significantly faster than both Investigator 1 and Investigator 3, but no significant difference was detected between methods. D. Micropad quality ratings between investigators and production methods. Agarose pads made using the manual method (red), a traditional method (green), and the 3D device (blue) (n=11 slides per investigator per method) were rated on a 1-3 scale, where 1 is an unusable pad and 3 is an ideal pad. Quality ratings differed significantly between investigators, but not between methods. E. The angle of tilt of the coverslip over the agarose pads made by three different investigators to generate a single agarose pad slide using the manual method (red), a traditional method (green), and the 3D device (blue) (n=11 slides per investigator per method). Tilt angles differ significantly between investigators, but not production methods. F. Image quality rankings between methods and investigators. A rating of 1 indicates an unfocused image, while a rating of 3 was assigned to ideal images. i) Shows the frequency of each rating given to brightfield microscopy images taken on pads made using the manual method (red), a traditional method (green), and the 3D device (blue). ii) shows a heat map of the different ratings across investigators using all 3 methods. Darker spots on the map indicate higher frequencies of a given rating while lighter spots indicate smaller frequencies. Eleven micropads (n=11) per investigator and per method were used. Three images were taken per micropad, and 33 cells per image were rated on a 1-3 scale. iii) shows a table representation of the total amount of pictures that were taken on each of their respective graded micropads. G. Image Focus Quality in S. pombe, C. elegans, and S. cerevisiae . i) A frame-by-frame, live-cell microscopy montage of fission yeast cell duplication in increments of 5 minutes up to 4 hours. ii-v) Brightfield and GFP fluorescence images of C. elegans strain RW1596 ( myo-3 ( st386 ) V; stEx30 ). Scale bar represents 100 µm in length. iv-v) Fluorescence imaging of fission and budding yeast, respectively, whose lipid droplets were stained with Nile Red. Scale bar represents 10 µm in length. For fluorescence images, a fire look-up table (LUT) was used to generate profiles where brightness is linked to signal intensity. H. Comparison of image and pad quality across investigator experience. The experience rank of the investigator correlates with both i) the quality ratings of the microscopy images (n=1089 cells per investigator) and ii) agarose pad quality rating (n=33 slides per investigator). I. Micropad production workflow in microscopy image acquisition experiments. Starting with the 3D device, micropads are made and then organisms are transferred onto the pad. Afterward, images are taken with a microscope. Each part of this workflow provides a checkpoint to check the quality of each step.

