
Table 3. . Antiproliferative evaluation of compounds 179–193 against A549 and MCF7 cells†,‡,§,¶.
| |||||
|---|---|---|---|---|---|
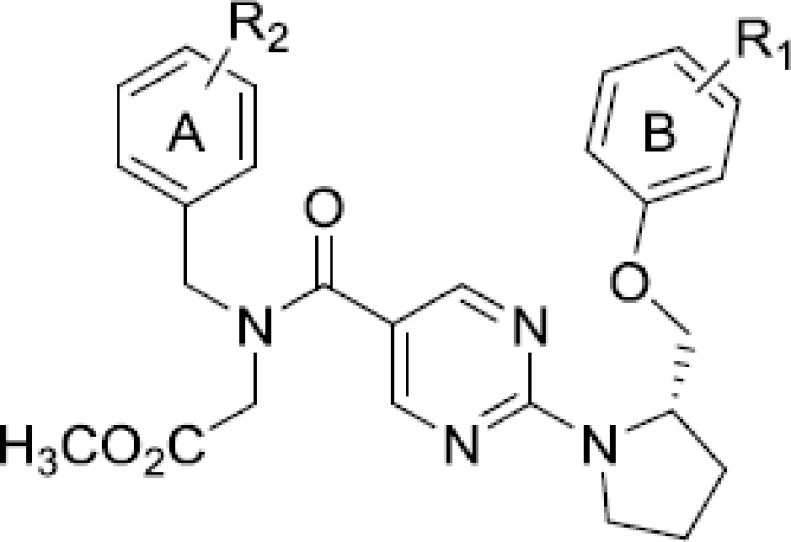
| Compound | R1 | R2 | A549 IC50 (μM) | MCF7 IC50 (μM) | HEK293 IC50 (μM) |
| 179 | 3-OCH3 | 2-Br | 32.9 (±2.9) | 6.1 (±0.6) | NT |
| 180 | 3-OCH3 | 2-CH3 | 17.6 (±1.7) | 14.0 (±1.3) | NT |
| 181 | 3-OCH3 | 4-F | 17.4 (±1.9) | 10.9 (±0.9) | NT |
| 182 | 3-OCH3 | 4-OCH3 | 16.6 (±2.0) | 8.3 (±0.7) | NT |
| 183 | 3-OCH3 | 2-OCH3 | 17.8 (±1.4) | 12.0 (±1.0) | NT |
| 184 | 4-Ph | 2-OCH3 | 38.0 (±2.6) | 9.8 (±1.0) | NT |
| 185 | 4-Ph | 2-Br | 39.2 (±3.6) | 3.1 (±0.3) | >50 |
| 186 | 4-Ph | 2-CH3 | 9.9 (±0.9) | 4.7 (±0.4) | >50 |
| 187 | 4-Ph | 4-F | 35.0 (±2.7) | 25.5 (±1.6) | NT |
| 188 | 4-Ph | 4-OCH3 | 10.0 (±0.8) | 1.0 (±0.1) | >50 |
| 189 | 3-CF3 | 2-Br | 24.0 (±1.9) | 5.9 (±0.5) | >50 |
| 190 | 3-CF3 | 2-CH3 | 9.6 (±0.9) | >50 | >50 |
| 191 | 3-CF3 | 4-F | 8.1 (±0.8) | 6.9 (±1.1) | >50 |
| 192 | 3-CF3 | 4-OCH3 | 6.4 (±0.5) | 5.9 (±0.8) | NT |
| 193 | 3-CF3 | 2-OCH3 | 5.7 (±0.5) | 8.4 (±0.9) | >50 |
†
A549 and MCF7 cells were incubated for 24 h prior to drug addition.
‡
A549 and MCF7 cells were incubated for 72 h at 37°C in 5% CO2 with the respective drug.
§
Cell proliferation was determined using an MTT assay.
¶
All experiments were performed in replicates of 6–8.
NT: Not tested.