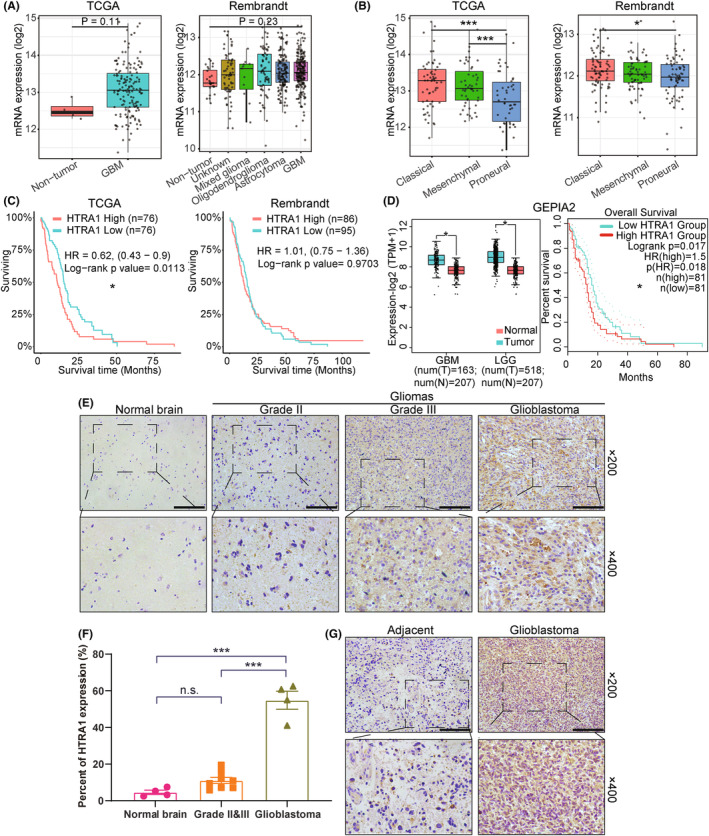
FIGURE 1.

Increased expression of HTRA1 is associated with high grade gliomas and worse prognosis in patients. (A, B) Expression levels of HTRA1 based on analysis of TCGA (n = 667) and Rembrandt (n = 537) databases displayed by (A) histology or (B) molecular subtype. (C) Survival rate of GBM patients with high or low HTRA1 expression levels based on analysis of the TCGA (left, n = 152) or Rembrandt (right, n = 181) database. (D) Expression levels of HTRA1 (GBM, n = 163; LGG, n = 518) and survival rate of GBM patients (n = 162) with high or low HTRA1 expression levels in GEPIA2 database. (E, F) Representative images of immunohistochemistry detecting HTRA1 in different grades of glioma and normal brain tissue. Bar graph of the percent of cells expressing HTRA1. Bar = 100 μm. (G) Representative images of immunohistochemistry detecting HTRA1 in glioblastoma and adjacent brain tissues. Bar = 100 μm. (A, B and F), one‐way ANOVA, post hoc Dunnett's test; (C) and survival analysis in (D), log‐rank test; Expression analysis in (D), Student's t‐test. *P < 0.05; ***P < 0.001.
