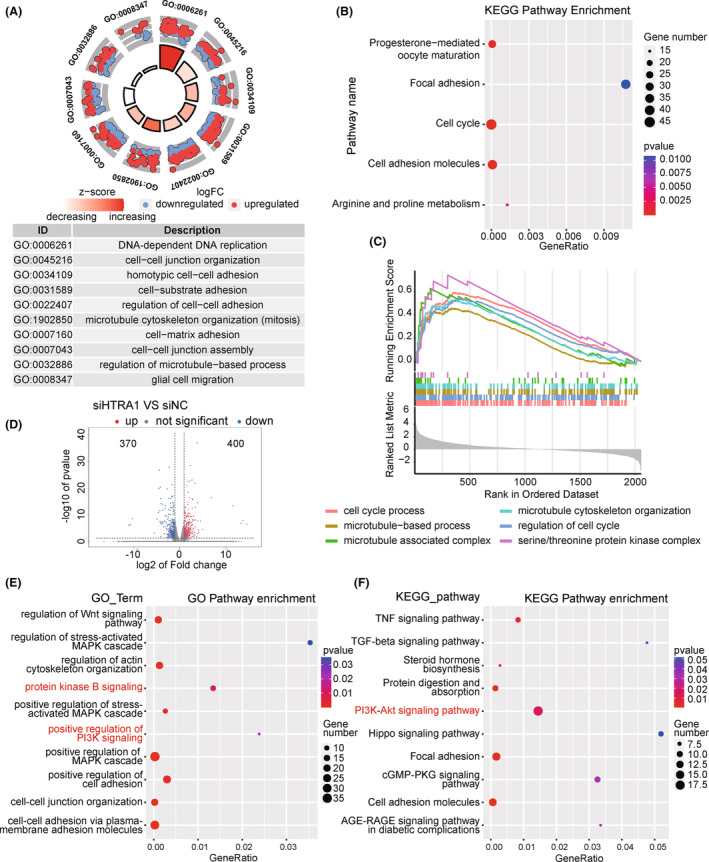
FIGURE 2.

Gene enrichment analysis of HTRA1 coregulated genes. (A–C) Gene enrichment analysis of expression‐correlated genes of HTRA1 by (A) GO, (B) KEGG, and (C) GSEA enrichment analysis. (D) Volcano plot showing the DEGs derived from RNA‐seq analysis. (E) GO and (F) KEGG enrichment analysis of DEGs derived from RNA‐seq analysis.
