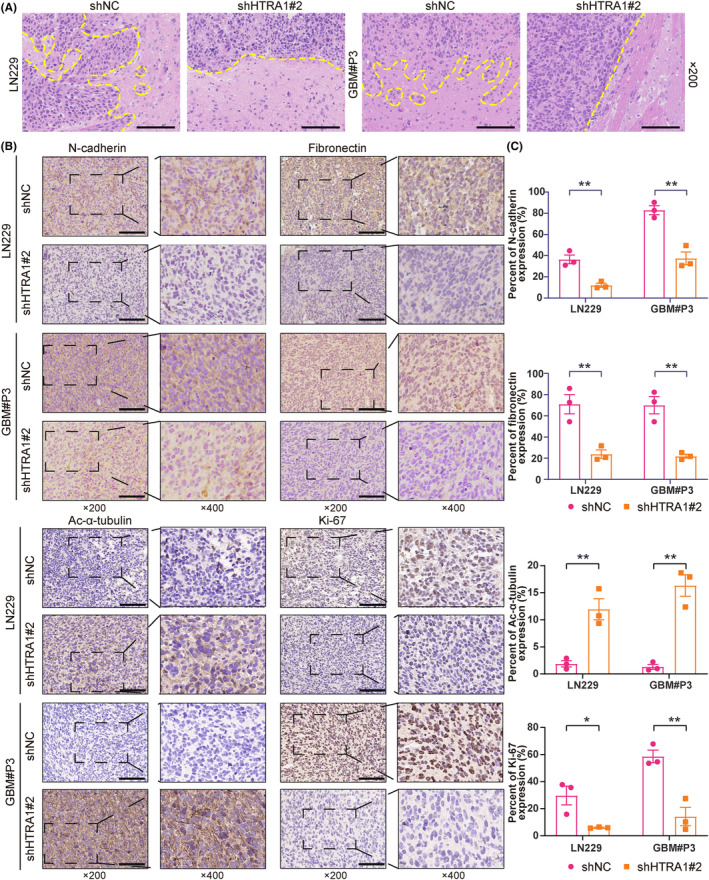
FIGURE 8.

Histologic results showing knockdown of HTRA1 downregulates GBM cell invasion and growth in vivo. (A) Representative images of HE staining showing the margins between xenografts and normal brain. Bar = 100 μm. (B, C) Representative images of immunohistochemistry detecting N‐cadherin, fibronectin, ac‐α‐tubulin and Ki‐67 in LN229‐ and GBM#P3‐shHTRA1 xenografts and the percent of expression of these four proteins. (C), Student's t‐test. *P < 0.05; **P < 0.01. Bar = 100 μm.
