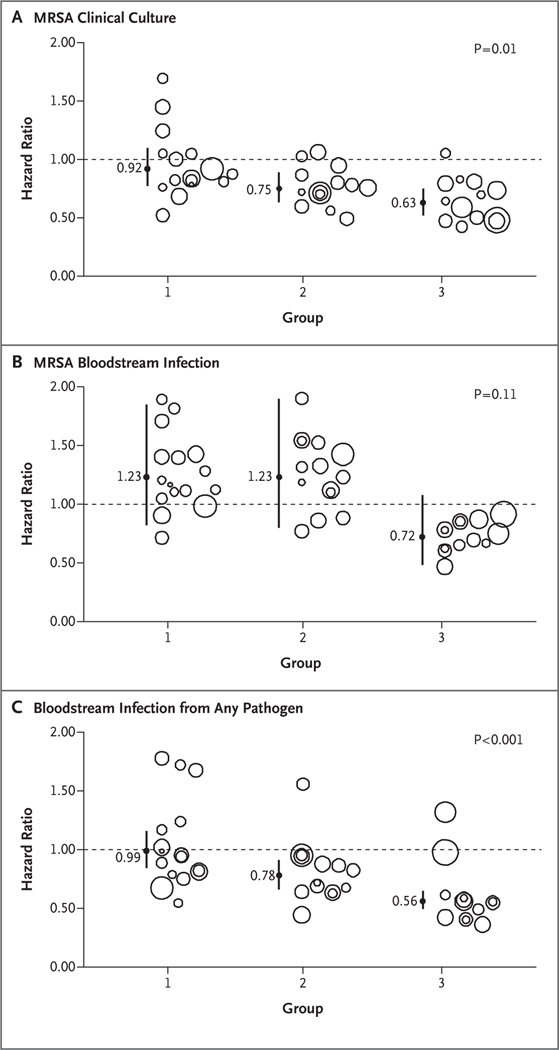
Figure 2. Effect of Trial Interventions on Outcomes.
Shown are group-specific hazard ratios and 95% confidence intervals (indicated by vertical lines) for outcomes attributable to the intensive care unit. Results are based on unadjusted proportional-hazards models that accounted for clustering within hospitals. Analyses were based on the as-assigned status of hospitals. Panel A shows hazard ratios for clinical cultures that were positive for methicillin-resistant Staphylococcus aureus (MRSA) infection, Panel B hazard ratios for MRSA bloodstream infection, and Panel C hazard ratios for bloodstream infection from any pathogen. Bubble plots of hazard ratios (predicted random effects or exponentiated frailties) from individual hospitals relative to their group effects are shown. The size of the bubble indicates the relative number of patients contributing data to the trial.

