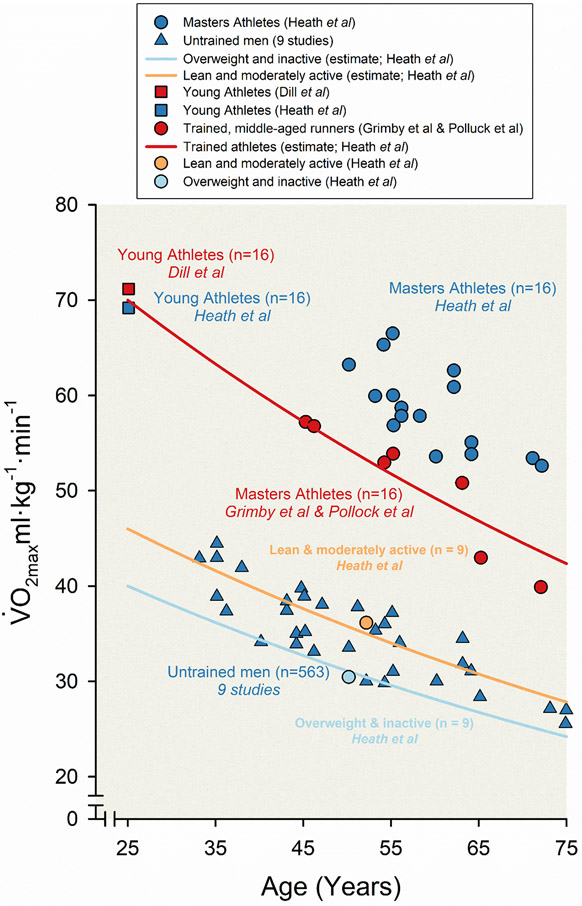
Figure 10. Age-related decline in maximal aerobic capacity () among both untrained and trained men.
Scatter and line plots displaying the decline in across the human lifespan from an amalgam of studies (8, 13, 27, 30, 42, 84, 88, 89, 139, 242, 289, 299, 300). In these experiments of nature, maximal aerobic capacity () was estimated using standardized, graded, maximal stress testing among champion male athletes with very high levels of physical activity and sedentary men with no formal training across the lifespan. Four sets of data from Heath and colleagues are represented, displaying the decline in between 16 highly trained male Masters endurance athletes (blue circles), 16 well-trained young athletes (blue square), nine lean and moderately active middle-aged men (orange circle), and nine overweight and inactive middle-aged men (light blue circle). Lines representing the estimated decline in among leaner and/or moderately active untrained men (orange line) and overweight and/or physically inactive men (light blue line) from Heath and colleagues are plotted based on two assumptions: (i) declines at a rate of 9% per decade beginning at 25 years of age, and (ii) average was 46 mL·kg−1·min−1 for untrained group A and 40 mL·kg−1·min−1 at 25 years of age. The line representing the estimated decrease in among trained men (red line) is plotted based on a presumed decline in of 9% per decade and a value of 70 mL·kg−1min·−1 at 25 years of age. Data from nine studies including 563 untrained men across the lifespan is represented as blue triangles. Data associated with 16 highly trained young male endurance athletes from Dill and colleagues is represented as red square. Data associated with well-trained middle-aged and older runners from both Grimby and colleagues and Pollock and colleagues are represented as red circles. Adapted from Heath et al 1981 (155).

