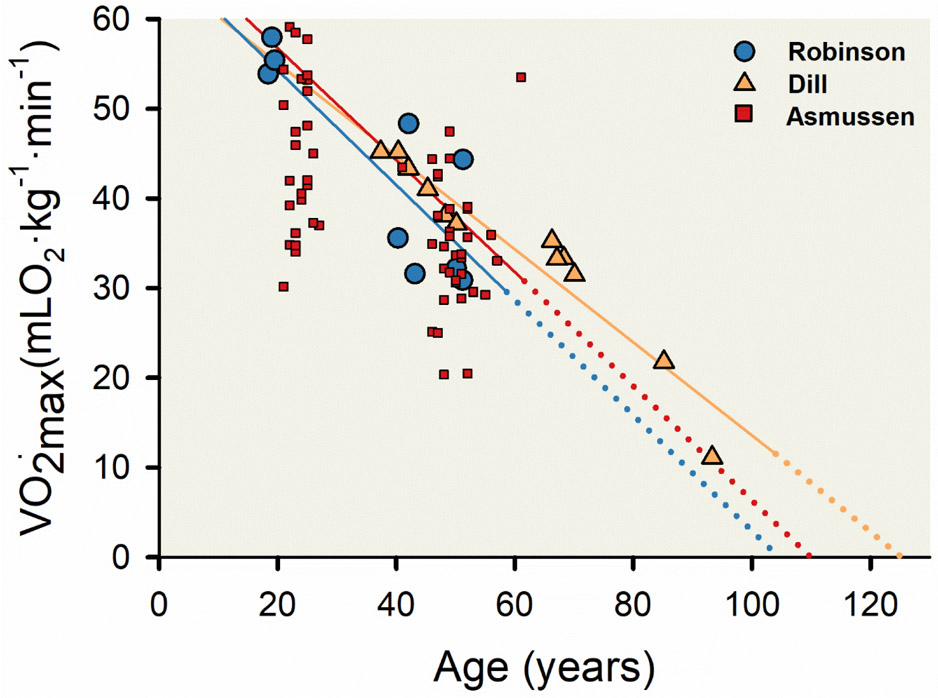
Figure 12. Association of maximal aerobic capacity () and human aging.
Three linear regression lines and corresponding scatter plots displaying the decline in across the human lifespan from three longitudinal studies—Asmussen et al [red line and symbols; (11)], Robinson et al [blue line and symbols; (301)], and Dill et al [orange line and symbols; (79, 258)].The solid portion of each regression line represents data as collected, and the dashed portion of each regression line represents a theoretical association extracted from each linear regression to its intercept on the x-axis. Data from Asmussen and colleagues represents 23 men who had their measured twice, the first between ages 21 and 27 years and the second between ages 41 and 61 years. Data from Robinson and colleagues represents three men who had their measured three times at ages 18 to 19 years, 40 to 43 years, and 50 to 51 years. Data from Dill and colleagues represents 12 measurements of D.B. Dill over a 56-year period. Linear regression equations of best fit and associated Pearson correlation coefficients were y = 69.37 - 0.6315x, r = 0.57 (Asmussen et al); y = 67.19 - 0.6458x, r = 0.83 (Robinson et al); and y = 65.28 – 0.519x, r = 0.96 (Dill et al). Adapted from Booth FW 1989 (35).

