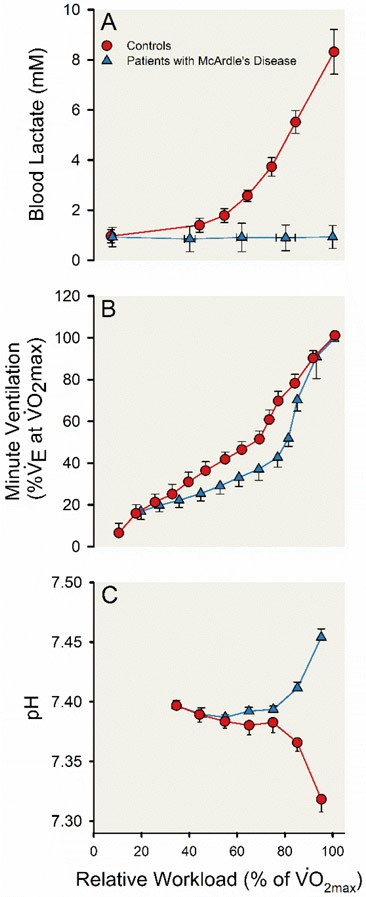
Figure 2. Physiological responses during progressive incremental exercise for control participants and participants with McArdle’s disease.
Line charts displaying the increase in blood lactate (A) and minute ventilation (; B) and change in arterial blood pH (C) during progressive incremental exercise until volitional exhaustion. The progressive incremental exercise test included four minutes of light exercise at a workload corresponding to 30% maximal aerobic capacity () on a bicycle ergometer followed by regular increases in workload every minute designed to elicit an approximate 10% increase in until a pedal frequency of 50-60 revolutions per minute could no longer be maintained. Twenty-six control participants (red lines and circles) and four participants with McArdle disease (blue lines and triangles) are represented. Symbols represent group means and the error bars represent standard error. Adapted from Hagberg et al 1982 (142).

